
Running a restaurant means you have a lot of important information at your disposal—sales reports, covers, table turns, online orders, reservations, and so much more. But when it’s time to plan the next shift or forecast the weekend demand, you might not know where to begin.
The thing is, when it comes to forecasting restaurant customer demand, the problem isn’t a lack of data or access to it. But which data matters the most? Because the same set of KPIs can tell very different stories depending on how you read them. Total sales may be high, but the hourly data may reveal fluctuating demand and inefficient staff planning.
That is why tracking the right KPIs gives you the clarity you need to improve the accuracy of your forecasts in the foodservice industry. You can turn your assumptions into actionable insights and make sure your staffing and inventory decisions align with the demand.
This blog focuses on the key metrics for forecasting restaurant demand to help you anticipate things better and plan with fewer surprises.
What you will learn?
- Why do you need to measure KPIs to forecast demand?
- The key restaurant metrics you can use
- How to ensure the accuracy of your restaurant forecasting processes?
What is Restaurant Demand Forecasting?

Restaurant demand forecasting focuses on predicting future customer demand based on historical data, customer traffic, and external factors over a specific period of time.
With demand forecasting, you can answer specific questions like-
- How many customers are likely to dine in or order online from my restaurant?
- Which menu items will be high in demand?
- How should I schedule my staff to align with the expected demand?
- How much inventory do I need to ensure smooth kitchen prep without over- or understocking?
With the right approach to forecasting, you can anticipate guest flow, plan staffing levels, and manage inventory to avoid issues during service. It also ensures your decisions are based on accurate information and rooted in your operational realities. Ultimately, this helps improve customer experience.
Why is Tracking Demand KPIs Crucial for Restaurant Operations?
Here’s something interesting. Consumer spending at restaurants in 2025 grew by 3% year over year, with collective spending being $1 million at restaurants every minute. So you know that demand is there. But how much of it is going towards your restaurant? Demand KPIs are a good way to do that.
Not to mention, managing a restaurant is already complicated enough. Add in analyzing and forecasting data into the mix, and it can throw anyone off. Tracking the demand KPIs makes your restaurant forecasting process a bit easier by ensuring you only work with the right data.
Here’s why you must track demand KPIs regularly for your restaurant-
- Make Data-Driven Decisions: Regularly tracking demand patterns like guest traffic or peak service hours and customer data like direct feedback means you’re working with actual data. This helps you make smarter business decisions based on facts.
- Eliminate Guesswork: Consequently, working with actual sales data also means you’re not relying on instincts anymore. Demand KPIs give you something more dependable to work with, ensuring more accurate planning and less waste.
- Ensure Planning Consistency: Without defined KPIs, the forecasting approach may vary from one restaurant manager or shift to another. Tracking the same demand metrics consistently establishes a consistent framework to follow. This creates better alignment across shifts, teams, and locations.
- Create Flexible Forecasts: Demand can shift quickly based on the day, time, channel mix, or local factors. Tracking demand KPIs helps you anticipate many of these changes early and adjust your sales forecasting accordingly. This gives you room to respond quickly without disrupting restaurant operations.
- Meet Customer Expectations: When staffing, prep, and inventory are planned around expected demand, your team is in a better position to enhance customer service. This leads to shorter wait times, fewer issues, and better customer satisfaction overall.
As Will Fleming, President at Global Shared Services, puts it, “If you have a good process and get good at forecasting, you’re going to know what you need to do to get to those results. If you don’t, the business result will be sometimes good or sometimes bad.”
Core Metrics for Forecasting Restaurant Sales and Demand
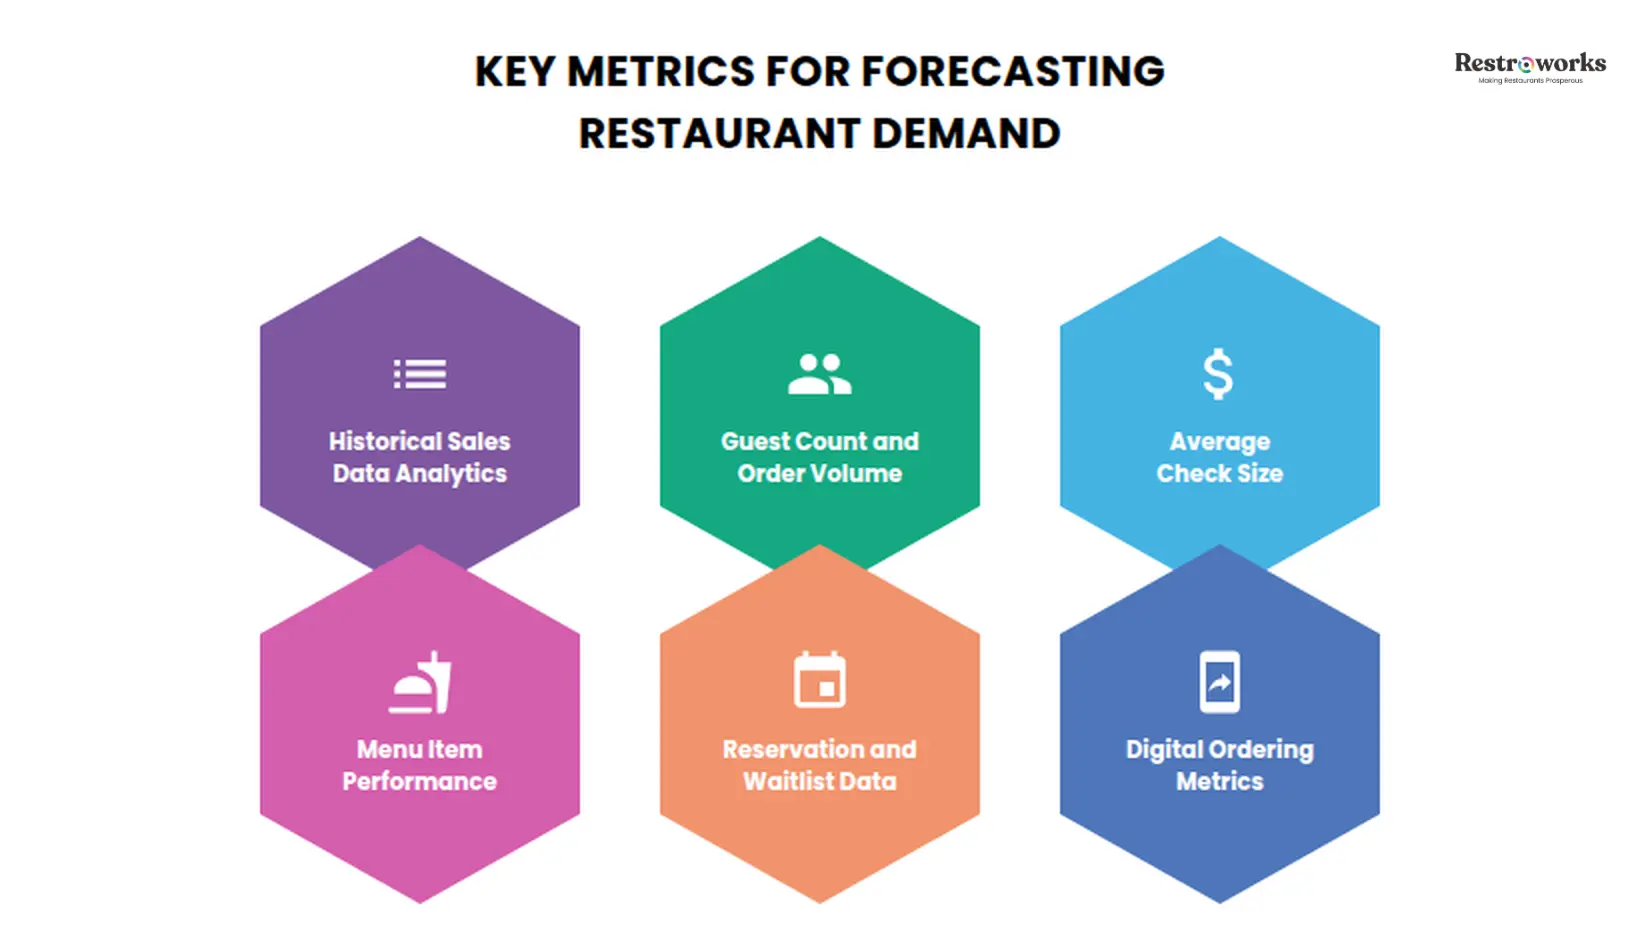
Effective demand forecasting starts with looking at the right metrics. Here are the important KPIs to track for your restaurant sales-
1. Historical Sales Data Analytics
Sales data is usually the first place anyone looks, and for good reason. It’s one of the few metrics that captures real demand over time. Every sale means there was a customer transaction.
But measuring total sales won’t be of much help on its own. Sales data tells you how much you made, not how demand worked. You might have made the same revenue on two days, but the traffic may look completely different. So, to make this data useful for sales forecasting, break down the sales into-
- Compare the sales for the same days across multiple weeks
- Break sales into hourly or at least daypart-level performance
- Look for short-term sales trends, such as a promotion that increased sales
For example, if your last four Saturdays experienced a steady customer traffic between 6 PM and 9 PM, you can use that as a pattern to plan for the upcoming Saturdays.
2. Guest Count and Order Volume
If there’s one metric that gets closer to defining the “true demand,” it’s this. Your revenue may shift for many reasons, be it pricing, discounts, or menu mix. But guest count (for dine-in) and order volume (for delivery/takeout) are good metrics to track to understand the actual demand.
Tracking the number of guests and online orders for a given day helps you do two things-
- Guest count helps you plan floor capacity and staffing needs
- Order volume helps you anticipate inventory requirements, kitchen prep, and ticket flow
These two metrics are critical for demand because a restaurant might see growing revenue and assume high demand. But this revenue may be increasing because of higher-value orders rather than more customers. In such a case, understanding the context behind customer preferences, such as the motive behind the visit at a particular time, matters a lot.
As Joseph Chartouni, CEO of Al-Sayer Franchising Company, mentions in a Restrocast episode–

Watch the full episode here-
3. Average Check Size
Average check helps you understand how much each guest or order contributes. It is calculated using the formula: Total Sales/ Number of covers in a period.
On its own, it doesn’t tell you much about demand. But when combined with volume metrics, you will understand how demand is behaving. For instance-
- An increasing guest headcount with a declining average check size may suggest shorter visits, lighter orders, or more price-sensitive behavior.
- A higher average check with consistent order volume can indicate upselling
This matters because it changes how your kitchen prepares for the service. Think of the average check as less of a demand predictor and more of a modifier. It tells you the type of demand you can expect, which directly impacts inventory management and kitchen prep.
4. Menu Item Performance
Like most restaurants, you’ll probably forecast demand at a high level, like expected sales, covers, or order volume. But that’s only half the story. What it doesn’t tell you is what that demand will look like inside the kitchen.
Menu mix forecasting makes your demand forecasting more applicable. When you know which items are likely to be in demand, you can prepare for those dishes in advance, get the right ingredients, and avoid shortages during service.
This is why menu mix matters. Instead of only looking at “how many orders,” you need to see-
- Which menu items sell more on specific days or time slots
- Dishes that take time to prepare
- How item demand shifts between weekdays, weekends, and peak hours
For example, if your past data shows that a particular entrée is ordered a lot during weekend dinner service, do plan for it in terms of prep and inventory management. If you ignore that and only forecast total demand, you’ll end up underprepared.
5. Reservation and Waitlist Data

Reservations are one of the few metrics that directly point to future demand. But at the same time, they don’t guarantee it. A full reservation dashboard doesn’t automatically mean you’ll have a full restaurant. You have to account for no-shows, late arrivals, and even walk-ins to accurately understand your demand.
So, to make reservation management data useful, you need more context, like-
- How far in advance do guests typically book?
- What percentage of reservations convert into actual covers?
- How much of your total traffic comes from walk-ins?
For example, if your restaurant historically had a 15% no-show rate, adjust your staffing requirements accordingly. Similarly, if you estimate that walk-ins will account for 25-30% of your guests but have low reservations, you can still consider it a busy night and schedule more employees for the service.
6. Digital Ordering Metrics
Your restaurant demand isn’t restricted to dine-in and takeaway anymore. With people shifting to food delivery for its convenience, you also need to consider online ordering volume and other metrics to accurately forecast demand.
For instance, you see that you have fewer dine-in customers after 9 PM. Naturally, you’ll assume things are winding down, and the kitchen can wrap up. But delivery orders pick up at the same time, which means your kitchen is still in full flow. So, if you’re only looking at dine-in numbers, you’ll miss that completely.
That’s why it helps to track digital orders separately and look at metrics for-
- When do online orders actually peak?
- Do weekends bring in more delivery than dine-in?
- Do promotions have an impact on online order volume?
Supporting Metrics for Accurate Forecasting
Looking at the core metrics is a good starting point, but they don’t always give you the full picture. That’s where supporting metrics come in to give you more context and improve your forecast accuracy.
1. Table Turnover

Table turnover rate tells you if you’re using your seating capacity efficiently. Even if you see the same number of covers on two different days, one with faster table turns can handle more guests in the same timeframe. From a forecasting point of view, table turnover matters because-
- Faster turnover will help generate higher capacity during peak hours
- Slower turnover will result in longer wait times and possibly even impact demand
As a result, you must account for the table turnover data for particular days, such as weekdays vs weekends. Without determining the turnover rate, you may hit your table and kitchen capacity earlier than expected, even if total demand is higher.
2. Labor Cost Percentage
While labor cost is primarily a financial management metric, it’s also closely tied to demand forecasting. On one hand, it helps you measure the total employee expenses against sales and sits ideally at 25-35% of revenue.
On the other hand, it is also a good indicator of how well you planned your staff around the demand. Think about it. There might have been a shift that didn’t go as expected, and you had staff waiting around with not much to do. The result? The labor cost goes up.
If you’re consistently seeing a higher labor cost, it’s a sign that you are overestimating the demand. This way, analyzing the labor cost percentage tells you whether your staffing decisions are actually aligned with demand, or if something in your forecast needs adjusting.
INDUSTRY INSIGHT
3. Inventory Turnover Ratio
Inventory turnover indicates how quickly the kitchen is using ingredients in relation to demand. So, if certain items are getting exhausted earlier than expected, it may be an early signal that demand for those dishes is higher than your forecast assumed.
On the flip side, slow-moving inventory means you’re overestimating. This is also where the impact is more serious. Food waste is a direct outcome of poor demand alignment. Restaurants in the U.S. generate over 11 million tons of food waste every year, and waste about 4-10% of the inventory they purchase.
To minimize this wastage, pair this information with menu mix data, and you can-
- Adjust purchasing based on actual consumption patterns
- Avoid overstocking items with low demand
- Prepare better for high-demand ingredients in advance
Your inventory data is readily available via your POS and inventory management systems. In fact, when you combine this data with real-time stock alerts and AI demand forecasting, you can reduce food waste, as a Cape Town restaurant did by 25%.
4. Seasonal Trends and Variance
A lot of the time, a change in your demand forecast has nothing to do with using the wrong data or calculation. Several external factors impact customer behavior and demand, which may be why your forecast for the week didn’t match as expected.
Using seasonal variance factors makes your forecasts more reliable and closer to reality. Here are the important seasonality metrics you need to consider-
- Weather Patterns: Weather changes like sudden rain or snowfall might make your customers stay home and order online instead. Or a good sunny day may encourage them to have a nice dinner out. It also affects how long customers stay and how much they order, which directly affects your demand.
- Seasonal Changes: Seasonal changes like holidays, vacation periods, or festive seasons can bring higher footfall. Look at these patterns across seasonal periods to plan your forecast.
- Local Events: Keep a simple record of local events and happenings, and see how your sales behave. If you notice events and which ones actually drive traffic, you can use that as a base to adjust forecasts for more upcoming events around you.
- Economic Indicators: Even something as simple as tracking sales around paydays or month-end periods can give you useful signals. This is because demand can fluctuate in case of economic changes like price increases or paydays, making them important metrics for forecasting sales.
- Competition and Market Trends: New restaurant openings, competitor promotions, and market saturation are key variables that directly impact your restaurant demand.
AI algorithms or machine learning models can actually help you predict the impact of these factors on your demand, using real-time store-level data.
Common Demand Forecasting Mistakes Restaurants Make

Even with the right metrics and forecasting tools at your disposal, mistakes can happen. Here are some major mistakes to steer clear of-
- Relying on averages too much: Average numbers don’t take into account the things that actually happened during the service that impacted demand. Only using numbers, without context or considering external factors, can lead to poor planning.
- Looking at demand at an everyday level: A single day may attract high demand, but is it equally distributed when broken down to the hour? Of course not. Demand cannot be consistent, but breaking it down to the hour informs you exactly when demand peaks and how you can plan for it.
- Combining dine-in, delivery, and takeout data: Customer demand behaves differently across ordering channels. If you combine them all for forecasting sales, you won’t be able to plan for, say, increased online delivery demand during a public holiday.
- Not tracking external factors: Weather, local events, or nearby competition can all impact demand. If you don’t track them, demand changes will always be inaccurate.
- Not updating forecasting models regularly: As your restaurant grows, so will the demand and priorities. Which means it is equally important to update your forecasting models with it to maintain relevance and accuracy with your consumer demand.
How to Measure and Improve the Accuracy of Restaurant Sales Forecasting?
You can only improve what you measure. If you actually want to improve forecasting accuracy and your customer experience, you need to go one level deeper.
You need a simple review process, combined with specific KPIs to measure how accurate your forecast is, where it’s failing, and how to fix it over time. Here’s how to go about it-
1. Start by Comparing Forecast vs Actual Demand
Before jumping straight to accuracy metrics, review expected vs actual. This will help you identify patterns and improve your methodology over time.
Depending on the needs of your restaurant business, review the following at the end of each shift or week-
- Expected vs actual covers or order volume
- Expected peak hours and periods vs what actually happened
- Where demand came from (dine-in vs delivery vs takeout)
For example, if your predicted total covers were close but the customer traffic came in earlier than you expected, you probably predicted the wrong peak hours. Or if delivery demand was higher than planned, perhaps you didn’t account for delivery channels. So these are the gaps you’ll refine using KPIs.
2. Measure the Forecast Accuracy
Once you start reviewing regularly, the next step is to quantify the accuracy of your forecasts. This is where the forecast accuracy KPI comes in. Instead of just eyeballing numbers, this gives you a consistent way to measure business performance across days or weeks.
In demand planning, you can measure this using the Mean Absolute Percentage Error (MAPE) metric, which expresses forecasting errors as a percentage of actual observations.
Use this formula- MAPE=1/n ∑|Forecast−Actual /Actual| ×100, where n is the number of periods.
Here’s an example. Say you expected 135 guests during dinner service and only 120 dined at your restaurant.
MAPE would be = |(135-120)/120| x 100 = 12.5%
A lower MAPE means better accuracy.
3. Check Forecast Bias
Accuracy alone isn’t enough to tell you the full story. You could always be close to your forecasts, but it also means you’re overestimating or underestimating demand, which is just as problematic.
Forecasting bias tells you which direction you’re going — always under or over your predictions. The formula is-
Bias = ∑(Forecast−Actual)/n
A positive result means you are underforecasting, while a negative result means you’re overforecasting demand. This is an important metric for accuracy because if you’re constantly over, you’ll always end up with wasted stock, employee shifts, and working capital. If food cost control is one of your operational goals, this is the metric to help your planning.
4. Track Patterns Over Time
Forecasting should get better with time. If it doesn’t, it can mean you’re not applying the learnings into your processes. Tracking signal helps you see whether your forecast is improving or repeating the same mistakes week after week.
In this step, ask yourself if your forecasting errors have reduced with time. Do you see a repetitive pattern in the results? With time, you’ll know with experience which metrics to use for restaurant forecasting, which to measure for accuracy, and how to make more predictable models for your restaurant business.
Tracking the right forecasting metrics is what eliminates guesswork from your demand planning and makes it more reliable. Without clear KPIs, you will only be looking at random numbers without really understanding what they mean or how they should influence your decisions.
Past sales data, guest count, and check size, order volume, menu item performance, and other such metrics all work together to give you the complete picture of customer demand. Over time, it will help you improve your staff and inventory management for higher cost savings and customer satisfaction.