The Critical Role of Data in the Restaurant Industry
Since the beginning of the information age, businesses have found data to be their primary fuel; hence, it’s no surprise that data is called the ‘new oil.’ From corporations to individuals, tonnes of data are produced that is ripe with insights. We have come a long way in terms of data collection strategies, as there are data collection touchpoints, quite literally, everywhere. With the rise of digital technologies and the growth of various customer touchpoints, restaurants generate vast amounts of data daily.
According to a report, restaurants that leverage data analytics can achieve a 5-10% revenue boost, a 15% dip in operating costs, and up to 20% improved EBITDA. However, the challenge lies in turning this data into actionable insights to drive business decisions and improve performance.
The importance of analytics in the restaurant business cannot be overstated. A study by McKinsey & Company found that companies using customer analytics extensively are more likely to outperform their competitors in profitability by up to 93%. Yet, many restaurant operators struggle to harness the power of their data. A report by Anaconda highlights that data practitioners spend about 37.75% of their time on data preparation and cleansing, leaving less time for interpreting results and making data-driven decisions.
Domino’s Pizza’s ‘Pizza Turnaround’ campaign is a tour de force of leveraging customer data and feedback to reinvent themselves successfully. Faced with declining sales and negative customer perceptions about the taste of their pizza, Domino’s embarked on a bold campaign to change their fate. They analyzed extensive customer feedback and discovered that many customers were dissatisfied with the flavor and quality of their pizza. In response, Domino’s completely revamped its pizza recipe, improving the crust, sauce, and cheese quality. They launched a transparent marketing campaign called “Oh Yes We Did” to address the changes and highlight the improvements openly. This data-driven approach improved customer satisfaction and led to a significant increase in sales and market share, solidifying Domino’s position as a leader in the pizza industry.
The Need for Real-Time Analytics in Restaurant Management
Real-time analytics can transform restaurants’ operations, offering insights that drive efficiency, enhance customer experience, and boost profitability. Let’s explore some critical areas where real-time analytics can make a significant difference:
Do You Know the Reason Behind Your Online Order Cancellations?

Understanding why online order cancellations is crucial for customer satisfaction and operational efficiency. High cancellation rates can indicate issues such as:
- Delays in order preparation
- Problems with delivery partners
- Miscommunication with customers
By leveraging enterprise analytics dashboards, restaurants can track cancellation reasons in real-time and identify recurring problems. This data allows operators to make necessary adjustments, such as optimizing kitchen workflows, renegotiating delivery terms, or improving customer communication. Addressing these issues promptly can reduce cancellation rates, enhance customer experience, and improve the restaurant’s bottom line.
Your restaurant management software should be adept at effective analysis of cancellation data. This is essential for identifying operational bottlenecks and implementing strategies to mitigate them, ensuring smoother and more reliable service for customers. An Enterprise Analytics Dashboard can track cancellation reasons in real time, providing insights into recurring issues. By analyzing this data, operators can identify and address the root causes, whether it’s adjusting staffing levels during peak times, improving kitchen workflows, or renegotiating terms with delivery partners.
Do You Know Which Order Channel Is Netting You the Most Business?

In any modern restaurant, multiple order channels such as dine-in, takeout, delivery, and online orders coexist, each contributing differently to overall revenue. Understanding the most profitable channels is essential for optimizing marketing strategies and resource allocation. Restaurants using omnichannel strategies achieve significantly higher customer retention rates than those not. By utilizing analytics tools that provide source-wise revenue analysis, operators can gain insights into the performance of each sales channel.
This data helps in identifying high-performing channels, focusing on:
- Effective resource distribution
- Targeted marketing efforts
Focusing on the most lucrative channels ensures that marketing budgets are spent effectively, driving higher returns on investment and enhancing overall profitability.
According to a survey, businesses using omnichannel strategies achieve 91% greater year-over-year customer retention rates than those without. However, keeping tabs on multiple ordering channels is imperative yet quite challenging. Analytics Cloud provides source-wise revenue analysis, breaking down performance by each sales channel. This allows operators to identify high-performing channels and allocate resources more effectively, ensuring marketing efforts are focused on the most lucrative channels.
Do You Know Which Menu Item Performs Best on Which Days?
Menu performance can vary significantly depending on the day of the week, time of day, holidays, or even seasonal conditions. Without understanding these patterns, restaurants might overstock less popular items while running out of customer favorites. Studies also indicate that restaurants that engineer their menus typically see a 10-15 percent profit increase. This phenomenon is due to customer behavior, which can fluctuate based on external factors such as holidays, local events, and weather changes. For instance, a hearty soup might be a top seller on a cold, rainy day, while a fresh salad might be more popular during warm, sunny weather.
Additionally, certain dishes may perform better during lunch than dinner, and vice versa. By analyzing sales data, restaurants can identify these trends and adjust their inventory and menu offerings accordingly. This ensures that popular items are always available and helps reduce food waste and optimize kitchen operations.
Understanding these patterns enables more effective marketing and promotional strategies, such as:
- Offering special deals on slow-moving items during their peak times
- Highlighting popular dishes on certain days to boost sales
Leveraging detailed menu performance insights can lead to better customer satisfaction, increased profitability, and a more efficient restaurant operation. A modern POS system menu performance feature tracks the performance of each menu item across different sales channels and times. This detailed tracking helps operators optimize menu offerings and promotional strategies, ensuring that popular items are always available when demand is highest.
Do You Know How Your Inventory Levels Are Affecting Your Sales?

Inventory management is a critical aspect of restaurant operations. Overstocking ties up capital and increases storage costs, while understocking can lead to stockouts and missed sales opportunities. Without precise inventory tracking, restaurants risk losing money on wasted food or disappointing customers with unavailable items. Implementing an advanced inventory management system allows operators to monitor stock levels in real-time, adjust orders based on historical sales data, and forecast future needs more accurately.
By maintaining optimal inventory levels, restaurants can:
- Reduce costs
- Improve cash flow
- Ensure a consistent supply of ingredients
All this leads to better overall service and increased profitability. The Enterprise Analytics Dashboard integrates inventory data with sales data, providing real-time insights into stock levels. This integration helps operators maintain optimal inventory levels, reducing waste and ensuring that popular items are always in stock.
Do You Manage Staff According to Peak Hours?

Staffing is one of the most significant operational costs for restaurants. Overstaffing during slow periods can erode profits while understaffing during peak times can hurt customer satisfaction and sales. Accurately identifying peak hours through data analysis helps create efficient staffing schedules that align with actual customer demand. This ensures enough staff members to provide excellent service during busy times without incurring unnecessary labor costs during slower periods.
Advanced scheduling tools can also help managers adjust staffing levels dynamically based on real-time data, leading to a more balanced workload for employees and a better customer dining experience. The live and hourly analysis feature of the Analytics Cloud monitors sales data up to the most recent hour, helping operators identify peak times. This real-time insight allows for better staff scheduling, ensuring optimal staffing levels that match customer demand.
Do You Know the Impact of Your Loyalty Programs?
Loyalty programs are powerful tools for driving repeat business and increasing customer lifetime value. However, it can be challenging to measure their effectiveness without proper analytics. A report by Accenture found that 77% of consumers participate in loyalty programs and claim their benefits much more quickly than they did three years ago. Still, many are underutilized due to a lack of actionable insights.
By utilizing analytics to track the performance of loyalty programs, restaurants can identify which rewards and incentives are most effective at encouraging repeat visits. This data helps in tailoring programs to better meet customer preferences, ultimately driving higher engagement and fostering long-term loyalty.
Do You Know Which Locations Are Underperforming and Why?
Understanding each location’s performance is critical for multi-location restaurant chains. Underperforming locations can drag down overall profitability, but it can be challenging to identify and address the issues without detailed analytics. Factors such as local competition, demographic differences, and operational inefficiencies can all contribute to poor performance. By implementing a robust analytics platform, restaurant chains can monitor key performance indicators (KPIs) for each location, compare them against benchmarks, and uncover the underlying causes of underperformance.
This insight enables targeted interventions, such as retraining staff, adjusting marketing strategies, or optimizing menu offerings to better align with local tastes and preferences.
Do You Know How Seasonal Trends Impact Your Sales?
Seasonal trends can significantly impact restaurant sales. Understanding these trends helps prepare marketing and operational strategies that capitalize on peak seasons and mitigate slow periods. According to a report by McKinsey, companies that leverage forecasted seasonal data insights see a 30-50% improvement in forecasting accuracy. By analyzing past sales data and external factors such as holidays, weather patterns, and local events, restaurants can predict high and low-demand periods.
This allows for strategic planning regarding inventory management, staffing, and promotional activities, ensuring the restaurant maximizes its revenue during busy seasons while minimizing losses during slower times. A modern POS system historical analysis tracks sales trends daily, weekly, monthly, and quarterly. This data helps operators plan for seasonal fluctuations, ensuring they are well-prepared for peak seasons and can implement strategies to boost sales during slower periods.
Do you track changing customer preferences?

Understanding customer preferences is crucial for menu development and marketing strategies. Tastes and preferences can change rapidly due to trends, seasonal variations, and cultural shifts. By regularly analyzing customer feedback, sales data, and market trends, restaurants can stay ahead of these changes and adjust their offerings accordingly. For example, the growing demand for plant-based options or the increasing popularity of specific cuisines can guide menu updates and promotional efforts.
This proactive approach meets customer expectations and differentiates the restaurant in a competitive market, driving repeat business and attracting new customers. Analytics Cloud tracks customer preferences and trends, providing insights into changing demands. You can understand what kind of food is selling the most and accurately validate your top-performing dishes. This data helps operators adjust their menus and marketing strategies to align with customer expectations, ensuring they stay relevant in a competitive market.
Do You Know the Financial Health of Your Restaurant?

Financial health is the backbone of any business. Restaurant operators might struggle with cash flow management, budgeting, and profitability without understanding key financial metrics. According to a report by Cornell University, 25% of restaurants fail in their first year due to financial mismanagement. Key financial metrics include:
- Profit margins
- Cost of goods sold (COGS)
- Labor costs
- Overhead expenses
Regular financial analysis helps identify areas where costs can be cut or efficiencies improved.
By maintaining a strong financial foundation, restaurants can better navigate economic fluctuations, invest in growth opportunities, and ensure long-term sustainability. The Enterprise Analytics Dashboard offers detailed financial analysis, tracking revenue, expenses, profit margins, and cash flow metrics. This information helps operators make informed financial decisions, ensuring long-term sustainability and growth.
The Power of Enterprise Analytics Dashboard and Cockpit App
The Enterprise Analytics Dashboard and Cockpit app are designed to address the above mentioned challenges, providing restaurant operators with a comprehensive solution for data-driven decision-making.
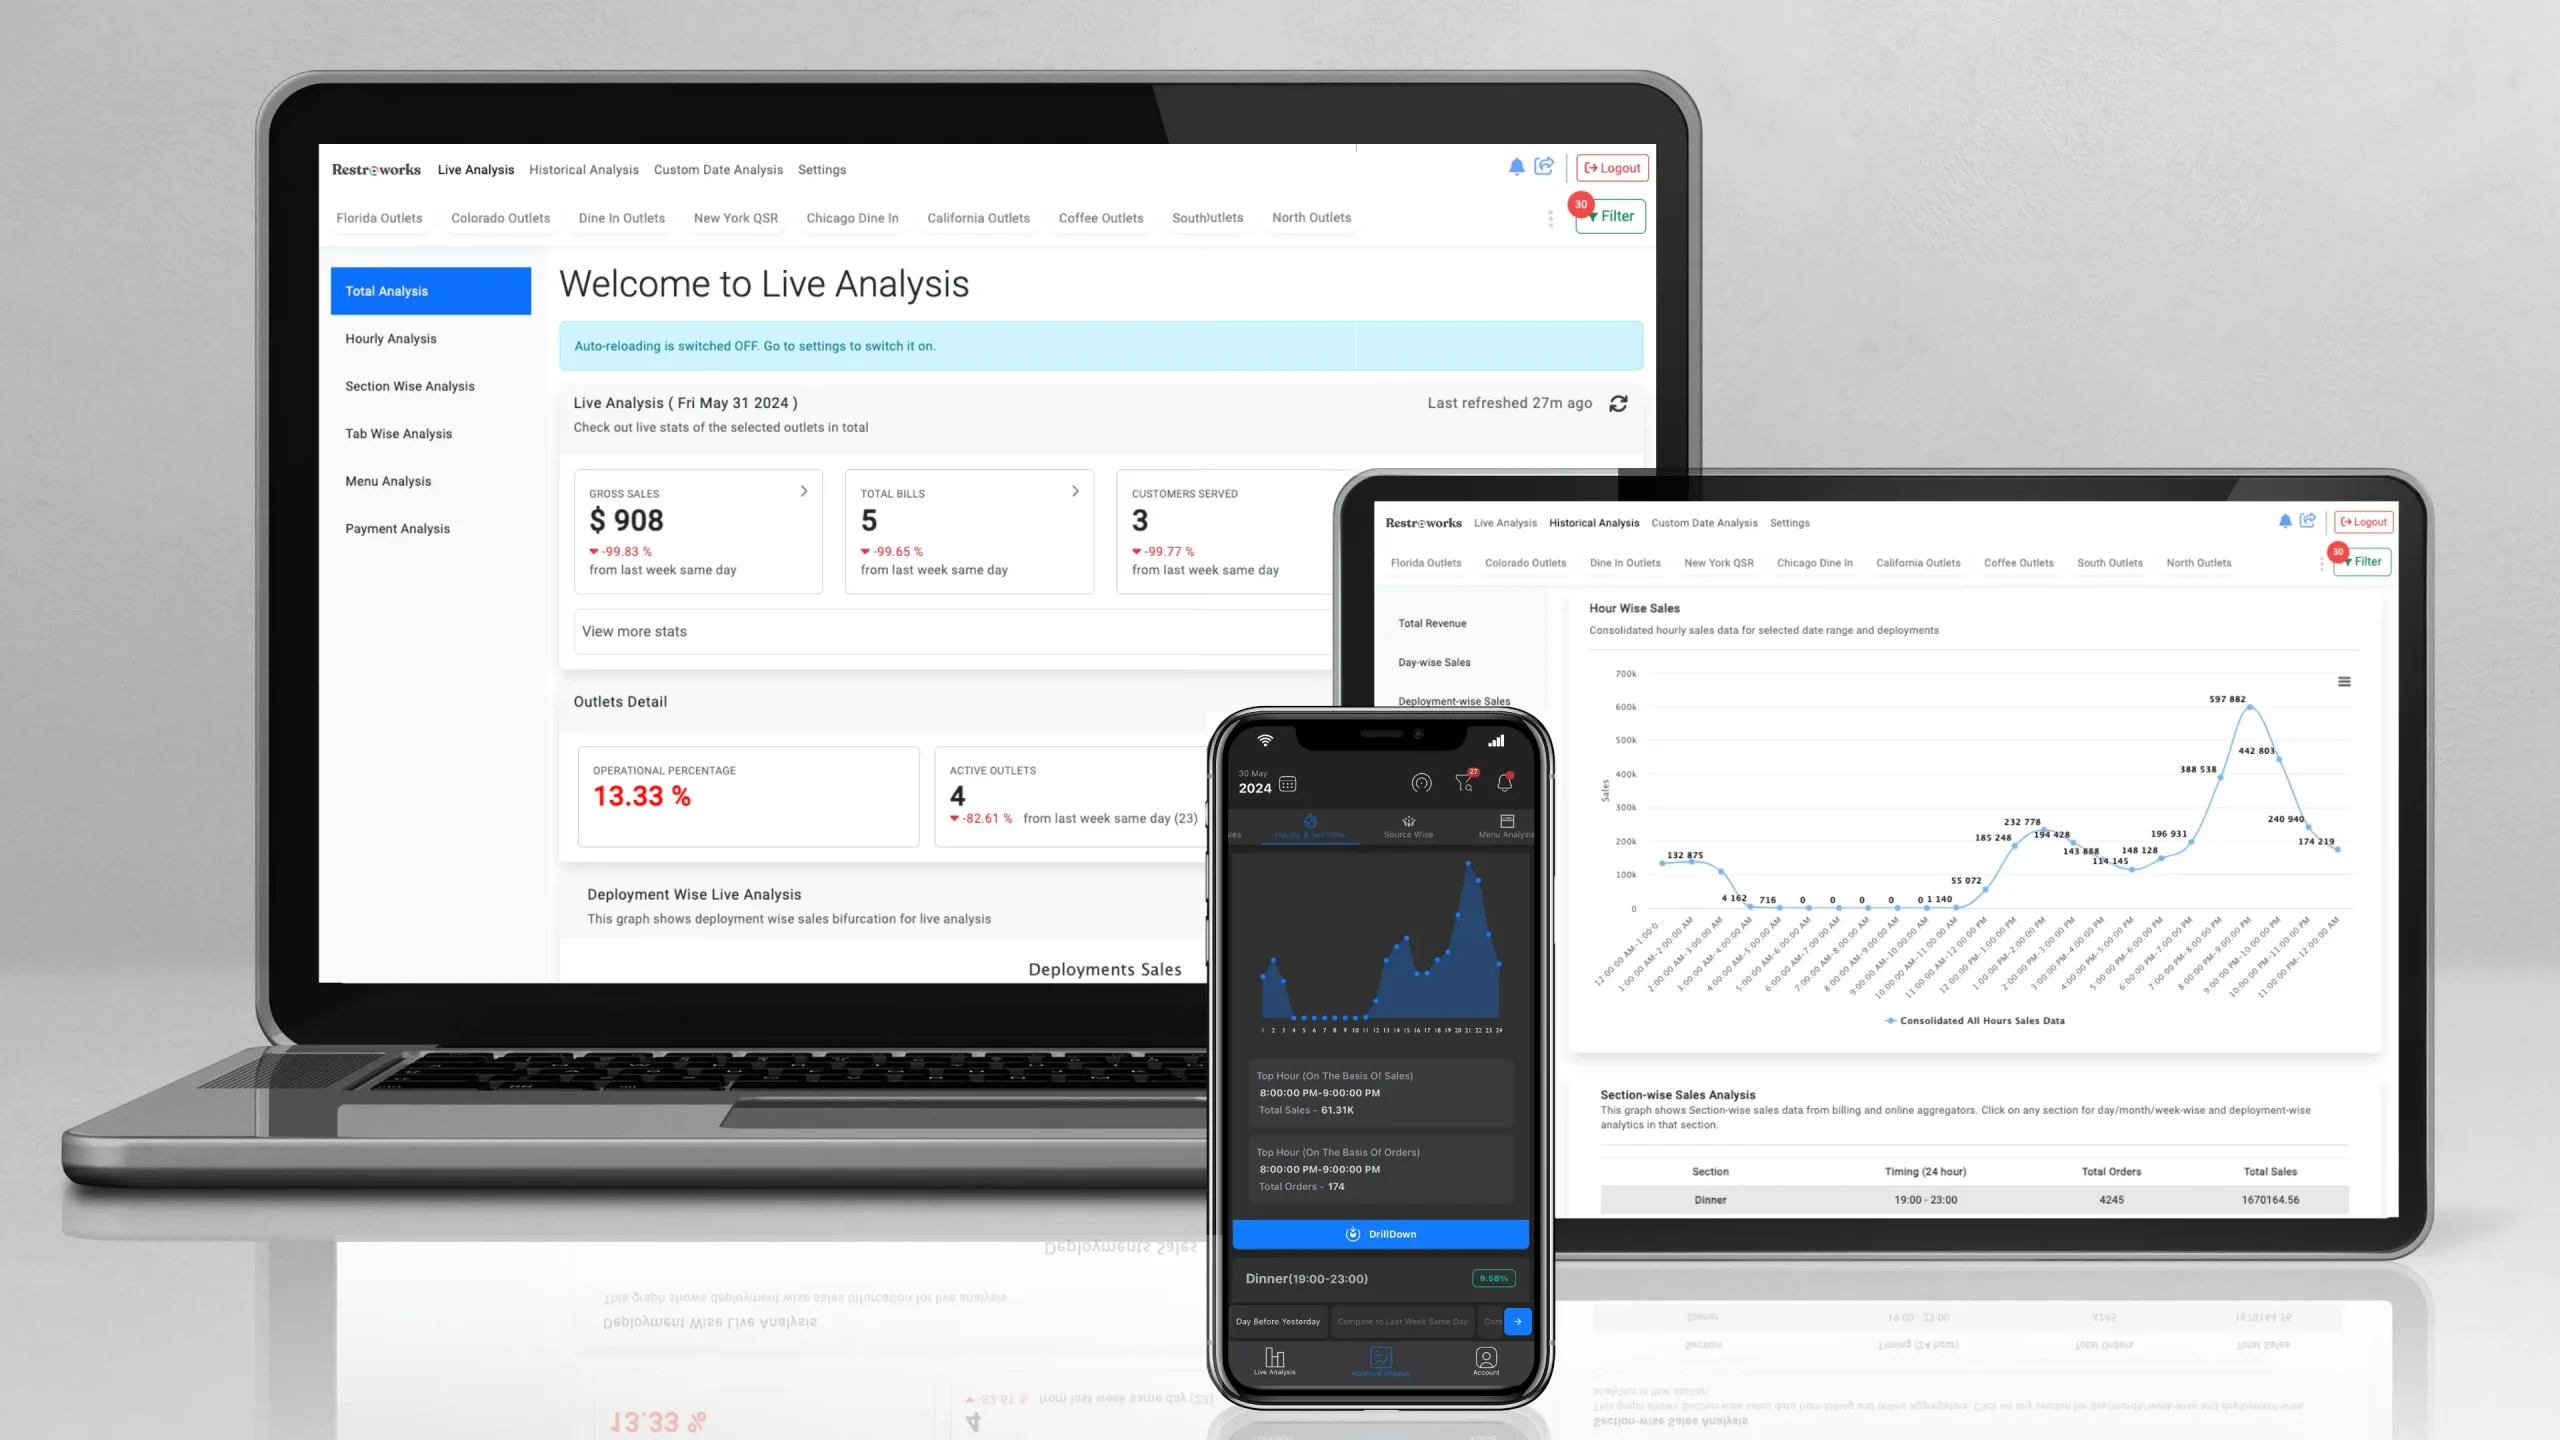
Live & Hourly Analysis
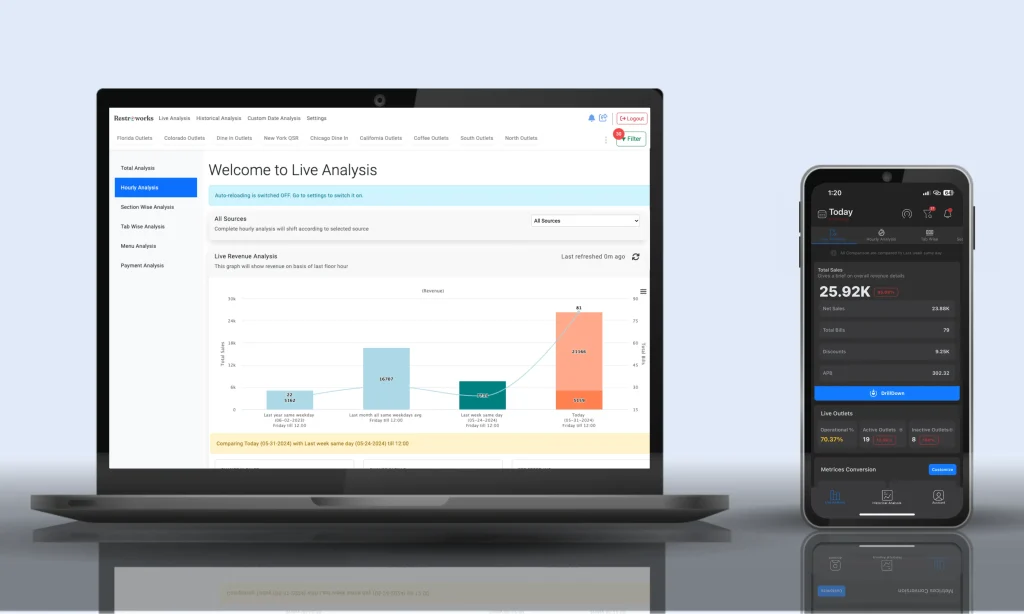
The live and hourly analysis feature allows operators to monitor sales data up to the most recent hour, providing real-time insights that enable agile management of daily operations. This feature helps immediately adjust staffing, inventory, and marketing strategies based on current trends.
Historical Analysis
Historical analysis offers in-depth insights into performance over various periods, helping operators with strategic planning and performance benchmarking. By comparing data across days, weeks, months, and quarters, operators can identify long-term trends and make informed decisions to drive profitability.
Source-wise Revenue Analysis
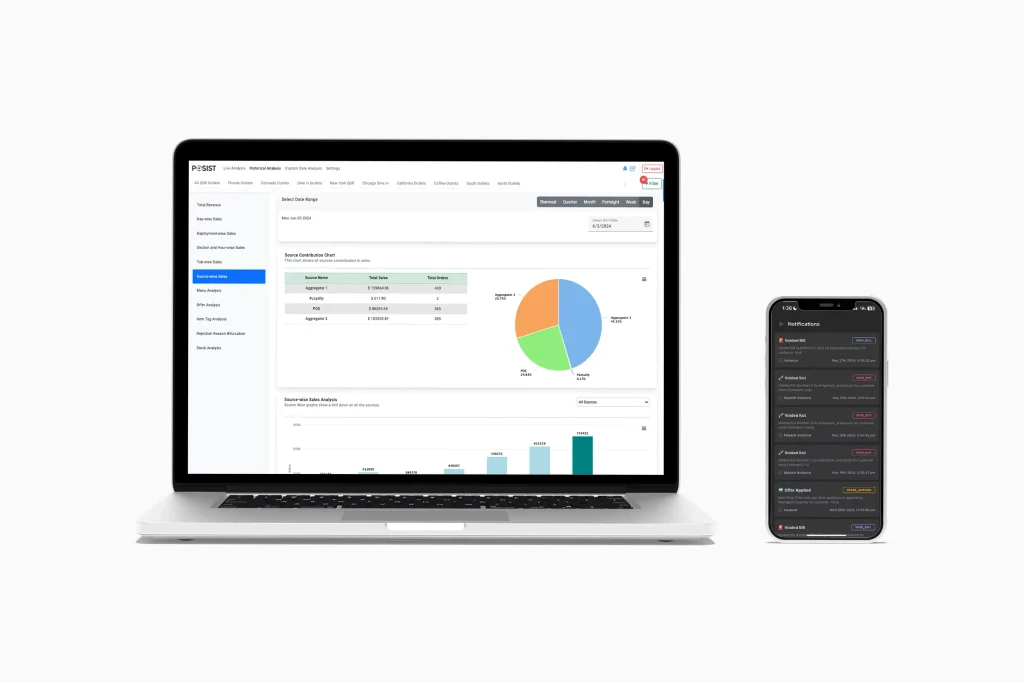
The source-wise revenue analysis feature breaks down performance by each sales channel, providing detailed insights into which channels drive the most revenue. This information helps operators optimize marketing efforts and resource allocation, focusing on the most profitable channels.
Menu Performance
Tracking the performance of each menu item across different sales channels allows operators to optimize menu offerings and promotional strategies. This feature ensures that popular items are always available and helps identify underperforming items that may need to be adjusted or removed from the menu.
PitDrop Feature
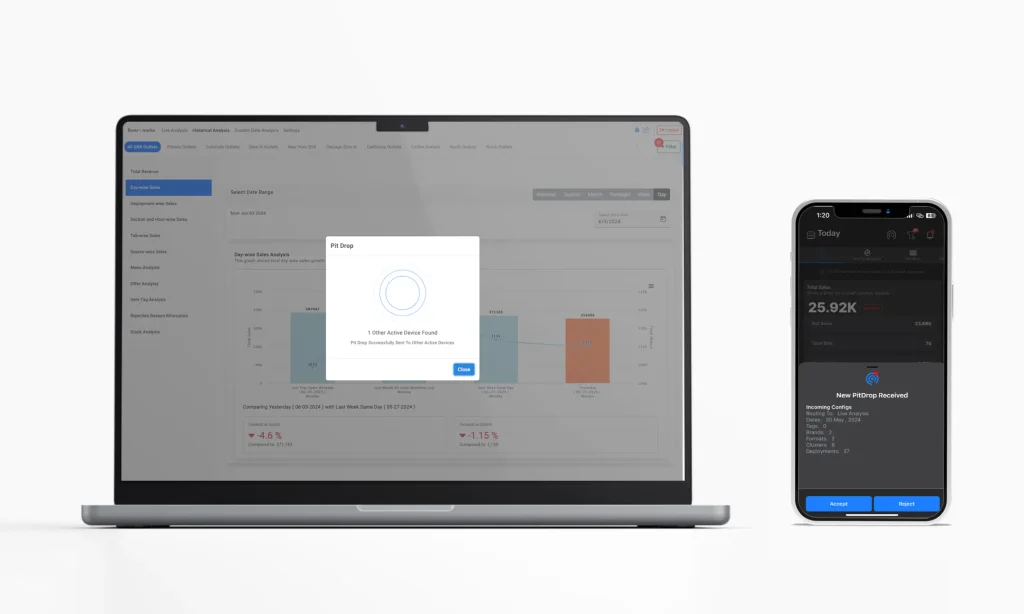
The PitDrop feature facilitates seamless communication within the team by allowing users to instantly share custom configurations of data visualizations from one device to another. This ensures all team members access the same information, enabling cohesive decision-making.
Wrapping Up
With features like live and hourly analysis, historical benchmarking, source-wise revenue tracking, and menu performance insights, a modern POS system helps operators address the critical challenges of modern restaurant management. By harnessing the power of data, restaurant operators can transform their operations, drive profitability, and provide exceptional customer experiences. In an industry where every decision counts, having real-time, actionable insights at your fingertips can be the difference between just surviving and truly thriving.