

It’s 2026, and the world is turning into a scorching furnace with temperatures pushing past 45°C across multiple regions. Something similar (though less intense) happened in 2024, too, and the restaurants, as a result, faced at least a 40% drop in footfall.
What does this mean – we just forecasted an inevitable demand dip for restaurants this summer.
Now, if we try to count factors that drastically impact customer demand, weather will come first. There are several others, too, that we’ll discuss in the article. But the main question is whether those shifts catch restaurant owners like you off guard, or if you see them weeks in advance and adjust head-on.
The latter is why forecasting slow periods in restaurants makes sense.
In fact, accurate restaurant forecasting helps restaurant operators/owners and managers:
- Predict sales and customer preferences
- Rework their customer experience strategies
- Improve inventory management
- Maintain customer satisfaction
- Make overall informed decisions around how they’ll manage the period, protect profit margins, who will do what, etc., etc.
More importantly, forecasting future sales gives restaurant owners a clearer picture of cash flow, staffing requirements, and operational risks so they can maximize profitability while building towards sustainable growth.
What You’ll Learn
- Why do demand dips often follow a predictable pattern & how can restaurant owners use tha information in their favor?
- How can you use historical sales data to build accurate sales forecasts?
- How should you adjust your labor costs, inventory, and cash flow before customer traffic slows down?
- How does accurate forecasting improve restaurant operations, financial management, and operational efficiency?
How Can You (& Why You Should) Identify Patterns that Slow Periods in Restaurants Follow?
So, data has it that Mondays and Tuesdays are the slowest days of the week for most existing restaurants. Plus, as for the month, January and February are the slowest because people have just taken a breather after long holidays, and most are trying to stick to their New Year’s resolution of not eating out and budgeting better.
August is somewhat slow as well, but for completely different reasons, as in families, at this time around, take vacations and cities empty out, so you kind of lose your regular customer traffic.
Now the problem with most restaurant operators is that they KNOW when exactly demand is going to drop and still haven’t built a system around it yet.
Karl Goodhew, speaking on the Restrocast podcast, captured the stakes well:
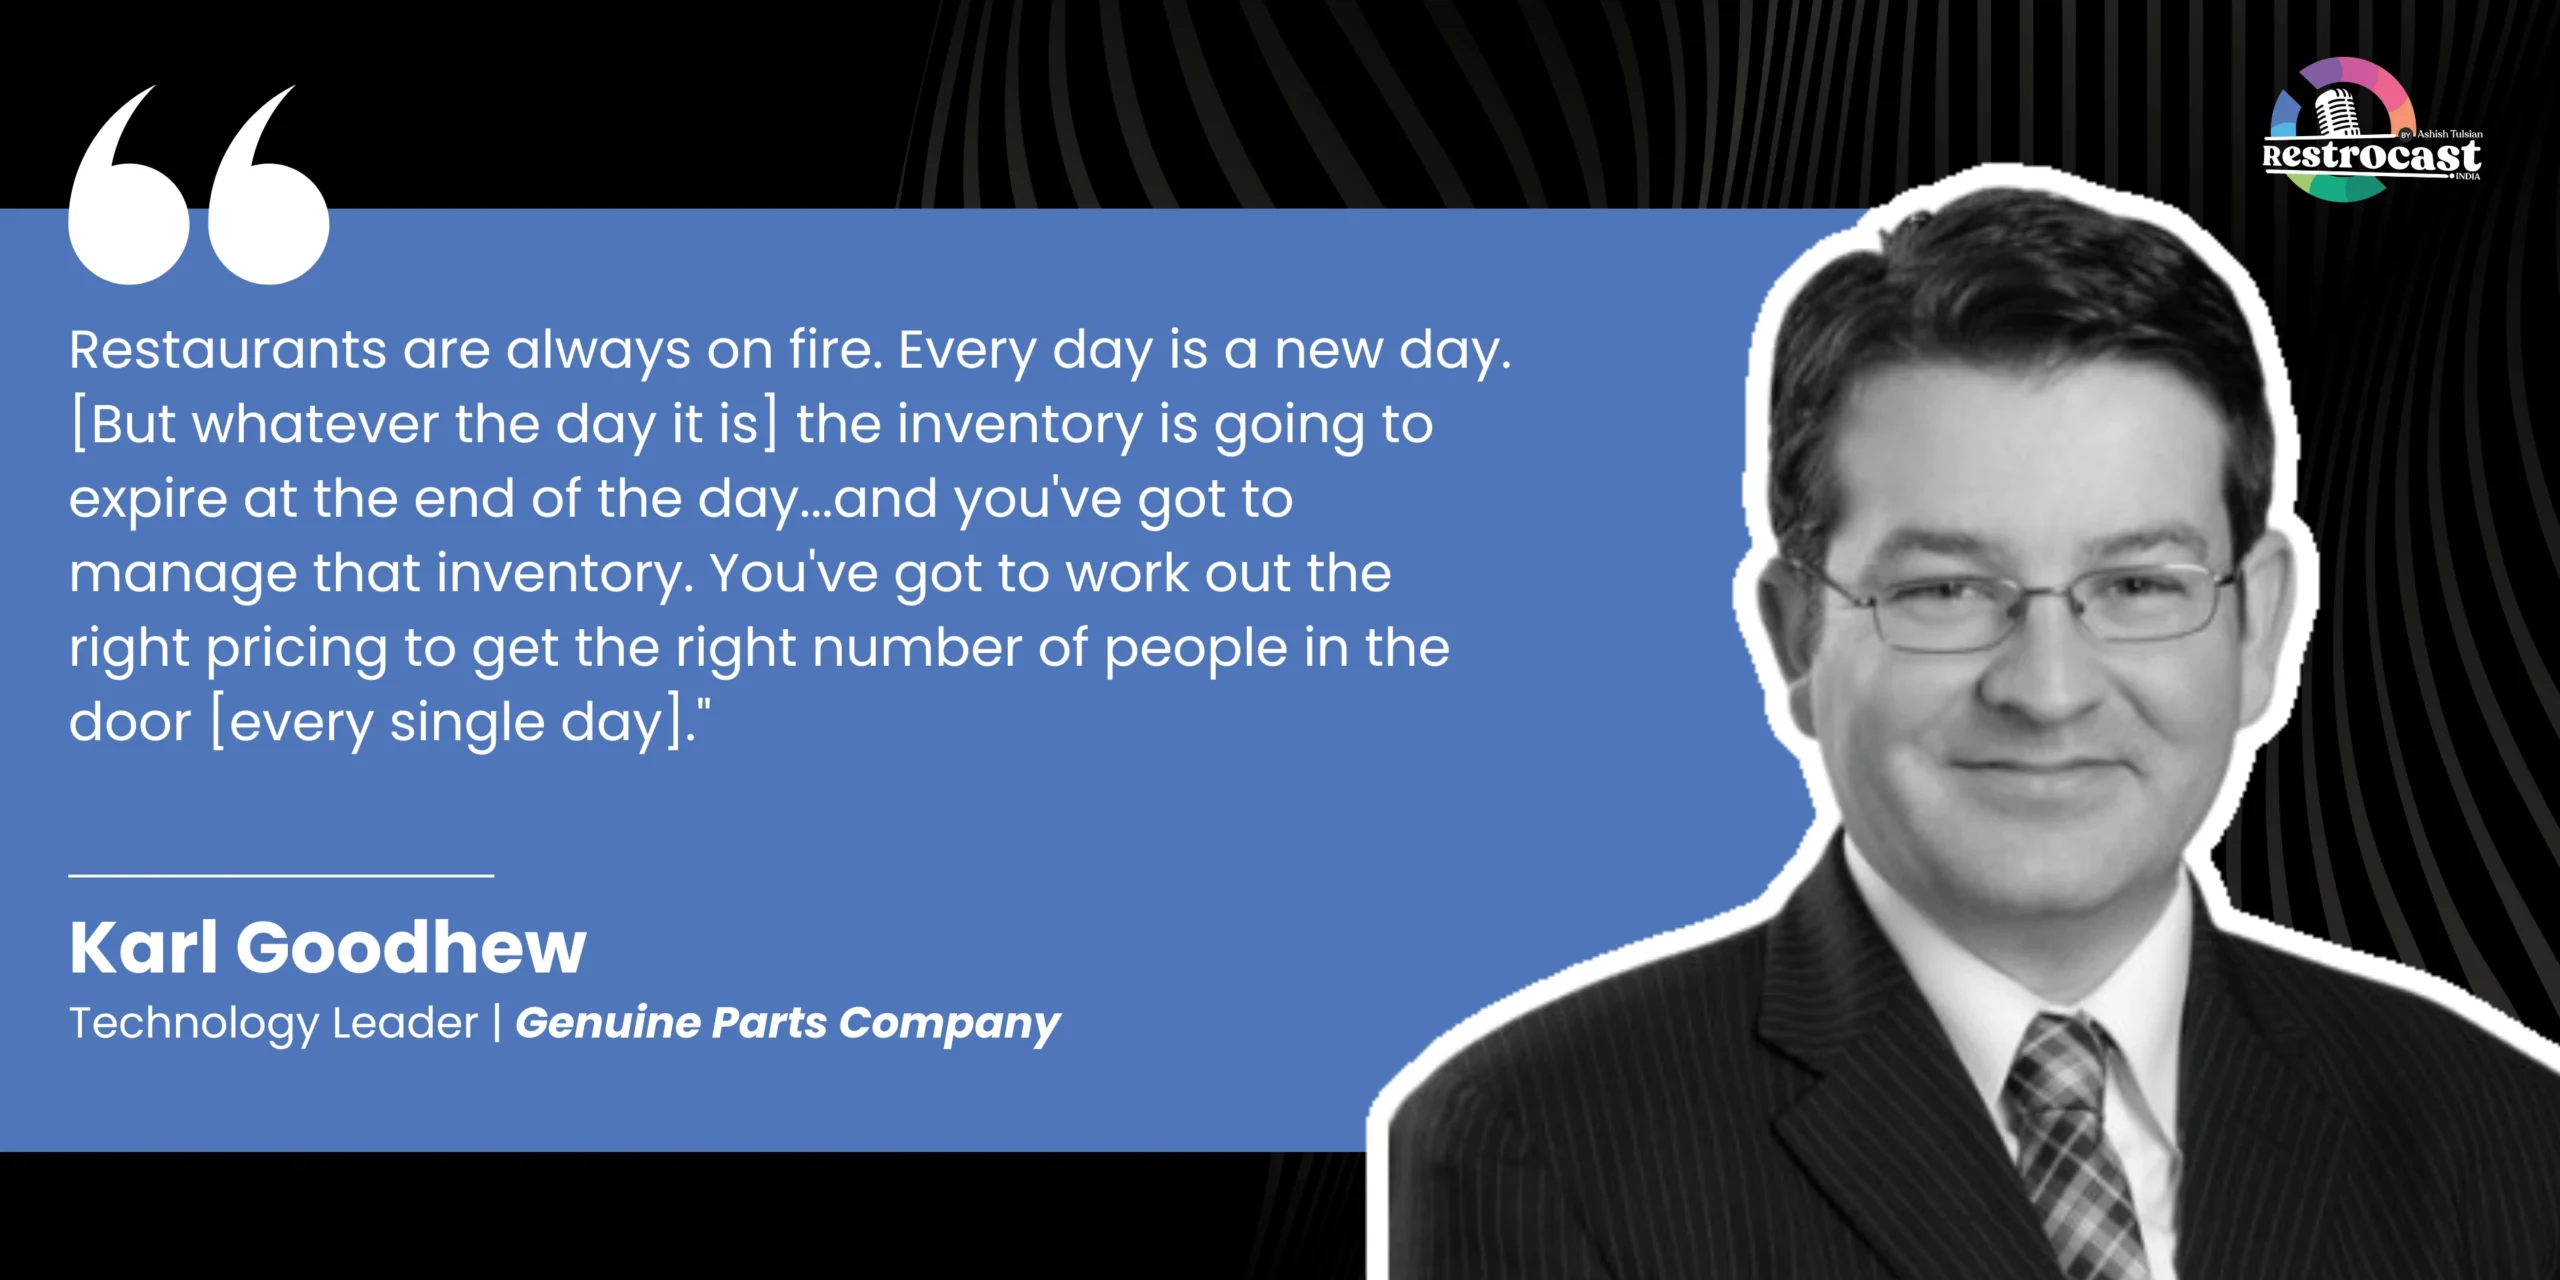
INDUSTRY INSIGHT
The Types of Forecasting & How Exactly Should You Implement Them?
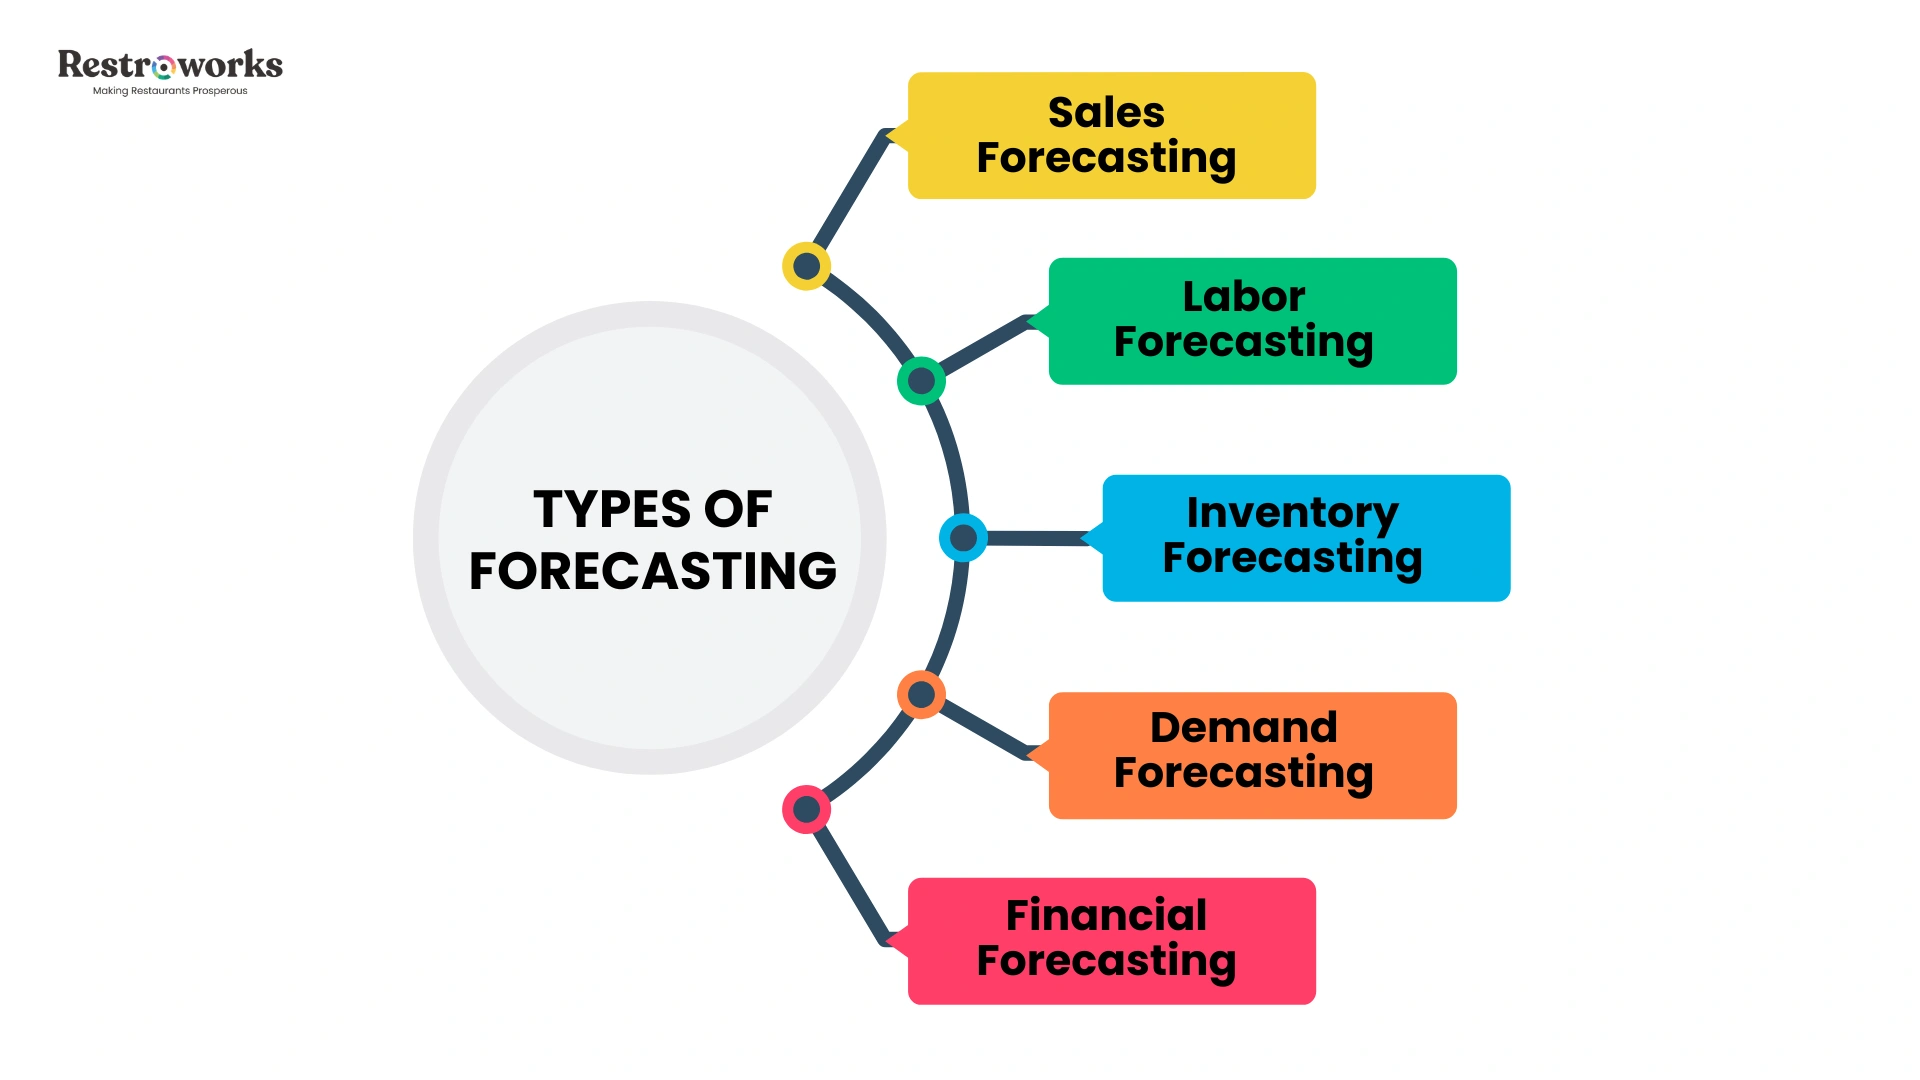
When we talk about restaurant forecasting, we usually cover these five parameters:
Sales Forecasting – It gives you a projected sales and future revenue that you might expect to make within a particular (or X or slow) period. Basically, how much are you likely to sell in August? This number comes as you analyze historical sales data, past sales, market trends, and various external factors like weather, local events, etc.
Labor forecasting – After your expected sales volume, you take that projection and work backward to determine your staffing needs. Like, use forecasting sales value to gauge how many servers/tenders you will need to sell to that amount within the X period? So, you schedule the forecasted week/day/shift accordingly.
Effective forecasting helps restaurants avoid overstaffing during slower periods and understaffing during busier hours.
Inventory forecasting – Next, what you do is adjust ordering and par levels to match projected sales. This way, you will ensure you neither over-order nor under-order in any circumstance. So, basically, with inventory forecasting, you are reducing the chances of food waste or stockout during the X period.
Demand forecasting – Here, you anticipate three things: how many customers will show up, what they will likely order, and when they will show up. Understanding customer behavior this way allows restaurants to adjust menu planning, staffing, and service standards to meet customer demand more effectively.
Financial forecasting pulls all the above data together and charts your cash flow, expenses, variable costs, etc., during the X period. Like how will you cover the fixed costs during the slow period, whether a credit line draw is likely, and at what level exactly will financial pressure kick in? This gives restaurant owners better visibility into financial pressure points and supports stronger financial management throughout the year.
That said, here’s how restaurant owners and managers can build a forecasting process and better align it with their labor, inventory, and cash flow needs:
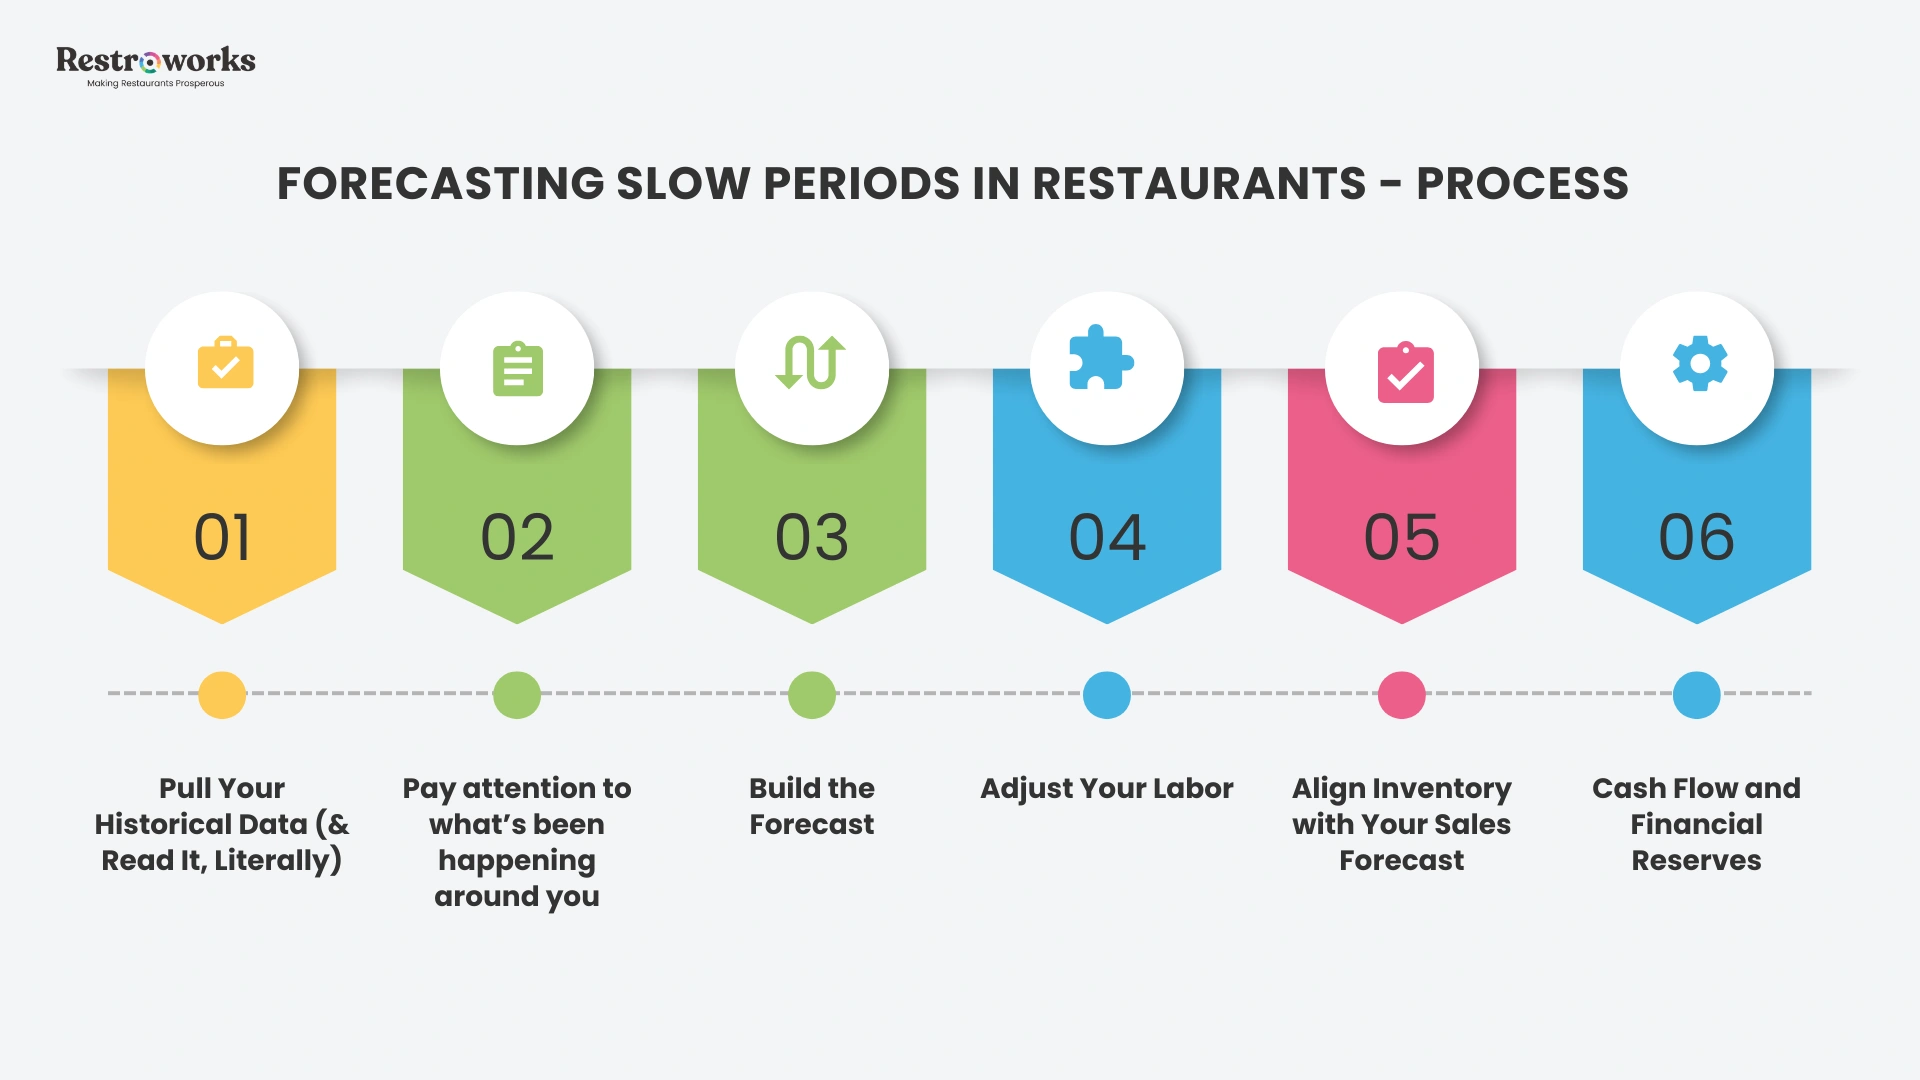
Step 1: Pull & Analyze Historical Sales Data (Read It Through and Through, Literally)
For accurate restaurant forecasting, you’ll need to pull in your past sales data. From where? Check your POS system. There you’ll likely find the numbers broken down by day, week, and ideally by daypart.
When analyzing historical sales data, look for:
- Which weeks of the year saw the sharpest drops compared to your baseline?
- Are those drops consistent year-over-year, or do they shift based on external factors?
- What does your average slow week look like in terms of customer demand, revenue, and check size?
- What were food and labor costs like during those periods?
Now you may want to know exactly how much of the data you should look into. Go for twelve months at a minimum. 2-3 years are even better as they will give insight into whether a particular dip is a seasonal pattern or one of the one-off market trends.
Once restaurant managers can see such patterns, forecasting future sales becomes significantly easier. Now, you can establish a baseline:
- How many covers on average do you receive on slow days/weeks?
- How much money do you make during that period?/ Or how much do you sell?
- How many staff members do you need on the ground?, etc.
So, next time a comparable event happens, you have an anchor for labor scheduling, inventory orders, and cash planning.
“Companies that aren’t good at budgets aren’t good at predicting the future. If you’re not good at predicting future demand, the business can sometimes be an accident.”
|
Step 2: “Gemini, What Does My Customer Demand Right Now?”
Works, but Gemini might not know that a parade is going to block your parking lot for a day, and thus, your customer traffic is going to be much lower. That’s why restaurant forecasting still requires human judgment.
Basically, look for –
Local Events – like a nearby festival, conferences, a parade – anything that might spike or suppress your restaurant’s footfall. Mark them in your calendar, and maybe color-code the events that are likely to slow down your future sales and restaurant operations with red.
Next comes seasonal variations. These are the most predictable external factors. If your restaurant is near an office or school, you’ll likely experience a slower period in June, when students have their summer break, and so parents don’t have to wait for their children at your place. But if you run a coastal seafood spot, summer will bring in more customers. Recognizing such patterns is essential for accurate forecasting.
Then, there are economic signals. Nearly half of U.S. adults said in 2025 they weren’t eating out as often as they’d like because of “cost.” When disposable income is tight, customer behavior is impacted, and so casual restaurant visits drop faster. If your customer base is price-sensitive, slow periods may run for a much longer time than your historical data could ever suggest.
Competitor activity determines the state your restaurant is going to be in for the particular period and beyond. A nearby competitor opening, closing, or running an aggressive promotion will show up in your restaurant sales data.
Factoring in even basic local market research (in a way that helps you identify trends) yields a more accurate forecast and ensures you make informed decisions at the end of the day.
Step 3: Build the Forecast
Honestly, the overall mechanics of forecasting future sales aren’t that complicated once you have the data.
The weighted average method can be a good starting point. This says – Give more weight to recent historical data, since your restaurant today reflects your last six months more than it did two years ago.
A reasonable approach is to weight the most recent year at 50%, the year before at 30%, and two years back at 20%. Apply those weights to the same period’s sales figures, and you have a starting projection. This creates more accurate restaurant sales forecasts because it reflects current customer behavior and market trends more realistically.
Next, adjust for known variables. If you know that a local event will suppress customer traffic, apply a downward modifier. If you’re running a promotion that reliably drives covers, build that in. The more honest restaurant owners are in incorporating external factors like seasonal variations, the more accurate your restaurant sales forecast will be.
Here’s the basic sales forecast formula you should be using to predict sales and your future revenue:
Projected covers × average spend per cover = projected revenue
From the projected future revenue you just calculated, derive your target labor cost percentage, your food order quantities, and how much revenue you’ll actually make during the period. Accurately forecasting demand is the lever that makes every other cost line deliberate instead of reactive.