
There’s a very famous quote:
“Companies that aren’t good at budgets aren’t good at predicting the future. If you’re not good at predicting the future, the business can sometimes be an accident.”
— Will Fleming, President, Global Shared Services
Yes, you heard it, and sorry to break it to you, but if you are treating forecasting beverage sales in restaurants as an afterthought, you’re losing money.
Consider this statistic: The global beverage market is estimated at $2.03 trillion this year, which is already up from $1.92 trillion in 2025, and the future revenue projections are set to reach $2.67 trillion by 2031. That’s a staggering 5.65% CAGR.
In the US alone, consumer spending will likely push restaurant industry sales to $1.55 trillion in 2026, with real inflation-adjusted gains of 1.3%. Revenue from out-of-home alcoholic drinks alone amounts to $622.77 billion in 2026.
What does this all mean? Drinks are not a mere side category. They’re a profit center. And still, most restaurant owners forecast them with a hunch.
This guide covers the actual strategies, like the KPIs, the models, the tools, and the day-to-day sales forecasting process for forecasting restaurant sales on the beverage side, “just as it should be done.”
What You’ll Learn
- Why do beverages require a separate sales forecasting model from food?
- How to build a beverage-specific forecast broken down by alcohol vs. non-alcohol, category, and day-part
- Which outside influences actually move beverage demand, and how to model them into your projections
How Can You Forecast Beverage Sales in Sync with Where the Market Is Headed?
Before building your beverage demand forecasting model, you need to first understand what exactly you’re forecasting. For record –
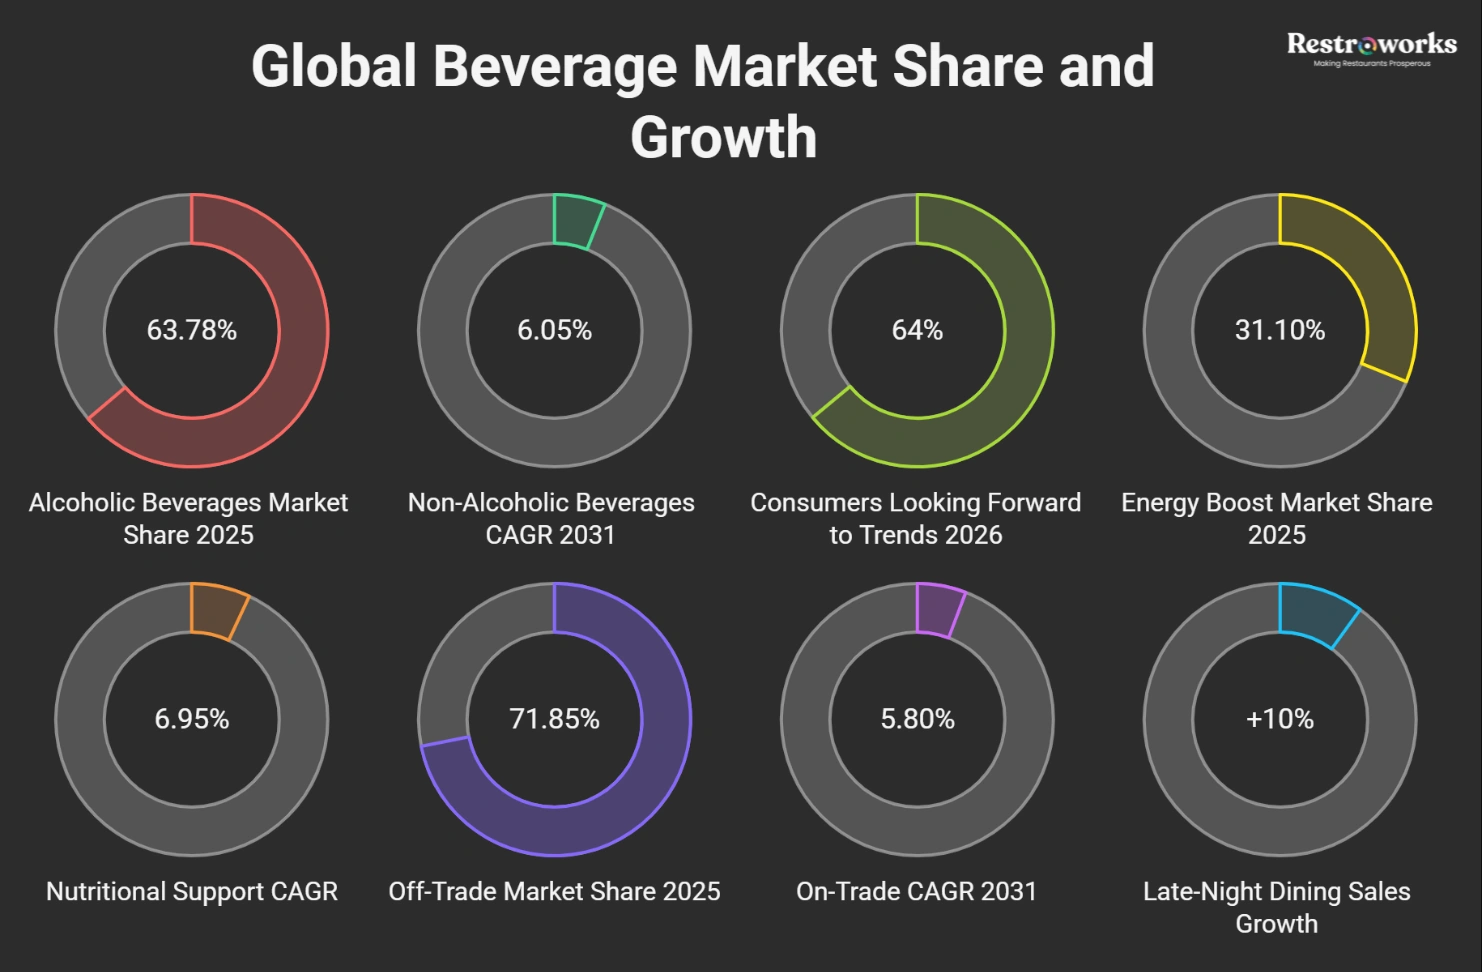
Alcoholic beverages held 63.78% of the global beverage market share in 2025. But that dominance is now under pressure.
Non-alcoholic beverages are growing at a 6.05% CAGR through 2031, driven by health-conscious dining, functional waters, prebiotic sodas, and premium zero-proof cocktails.
In fact, 64% of consumers say they’re looking forward to new food and beverage trends in 2026. And why not? They know exactly why staying ahead of these shifts is a core part of getting the restaurant forecasting right.
Plus, the energy boost segment already captured a 31.10% share of the global beverage market in 2025. The nutritional and functional support segment is expanding at a 6.95% CAGR, which is btw the fastest-growing applications in the category.
On the channel side, off-trade commanded 71.85% of the global beverage market share in 2025, but on-trade (restaurants, bars, & hotel dining) is rebounding at a 5.80% CAGR through 2031.
That’s your segment, and it’s growing. But the question is whether your sales data is sharp enough to capture it. Restaurant forecasting gives you that answer.
Late-night dining, for example, is emerging as the standout growth story in limited service restaurants, with sales climbing more than 10% annually since 2021 (McKinsey, 2026). If your beverage forecasting process doesn’t account for day-part (i.e., separately tracking morning, lunch, happy hour, dinner, and late-night drink demand), you’re missing the pattern entirely. After all, it is this kind of proactive forecasting that separates restaurants that merely react from those that plan smarter and protect profit margins before a slow period hits.
Why Beverage Sales Forecasting is an Entirely Different “Genre” in Itself?
Most restaurant forecasting articles tend to blend “food” and “beverages” in the overall sales number. That’s the wrong framing, and it weakens your sales forecasting from the ground up. Why? Because beverage demand responds to these triggers in a very different way:
Weather, for example, is one factor that influences drink orders more than any other external factor.
- In India, restaurant sales declined dramatically during the 2024 heat wave.
- Hot drink orders drop 30–40% in peak summer.
- Frozen and cold beverage demand, on the other hand, spikes.
Overlaying weather data on your historical sales data is one of the most underused moves in beverage sales forecasting. It’s also one of the most impactful for inventory management, i.e., when you know exactly when cold drink demand will spike, you can order more accurately and avoid waste.
Next are local events. They reshape an entire evening’s drink mix. Pubs see a documented sales hike during World Cup games. A marathon, a concert, a graduation weekend — all of these change customer traffic and what’s being ordered.
Group dynamics, too, play out differently with drinks. When one guest orders a bottle, the table often follows. That social contagion effect doesn’t exist in food the same way. And that makes tracking customer behavior around group orders a key lever for sales forecasting that most operators overlook.
Alcohol vs. non-alcoholic beverages have completely different demand drivers, regulatory considerations, and profit structures. They need to be forecast separately as well.
Remember: Customer satisfaction is directly related to the intention to return to the restaurant in the next 30 days, with satisfied customers showing stronger return intent. A sold-out drink special or an empty bar during a slow period both damage that satisfaction, and both come from poor inventory management and inventory forecasting. Accurate forecasts on the beverage side are just as important as on the food side. |
What are the Three Types of Beverage Sales Forecasting?
There are basically three primary ways restaurants can forecast future sales, and all three, of course, apply to beverages as well. Understanding which type of sales forecasting applies to your situation is the first step to building reliable projected sales. Each plays a different role in the overall sales forecasting system.
Time-Series Forecasting
It focuses on past sales data to predict future results, assuming that patterns repeat. This is your baseline — and in restaurant forecasting, accurate restaurant forecasting starts here — with a systematic look at past sales patterns before layering anything else on top.
What you need to do is pull your sales history by beverage category (beer, wine, spirits, cocktails, non-alcoholic) for the same week in the past two to three years.
The seasonal patterns you notice repeating will be your starting projection. Using historical sales data is crucial for identifying seasonal trends, which can help inform future forecasts and improve operational planning from labor scheduling to inventory projections.
Causal Forecasting
It connects your sales data changes to external influences like weather, local events, & marketing efforts. And this is where beverage forecasting gets super-specific.
For example, if there’s a local festival on Friday, your causal model will flag a 20–30% spike in draft beer and cocktail demand. On the other hand, if it’s a rainy Tuesday in January, your hot drink forecast will climb. This type of demand forecasting is what lets restaurant owners stop reacting to swings in customer traffic and start anticipating them.
Qualitative Forecasting
It relies on human judgment and input from staff when historical data is limited. New restaurants, new menu launches, and new beverage categories all require this type of forecasting. And why not? Your bartender who’s been in the particular neighborhood for 8+ years knows things from the inside out.
This is also where market research plays a role. When past sales don’t tell the full story (say, for a brand-new zero-proof cocktail menu), market research and qualitative input from experienced staff fill the gap and ground your forecast in real customer expectations.
Must listen: The 2026 Food & Beverage Forec… – The Food Intelligence Podcast – Apple Podcasts
How Can You Build Accurate Forecasts for Your Beverages Step-by-Step?
There are five steps to be precise:
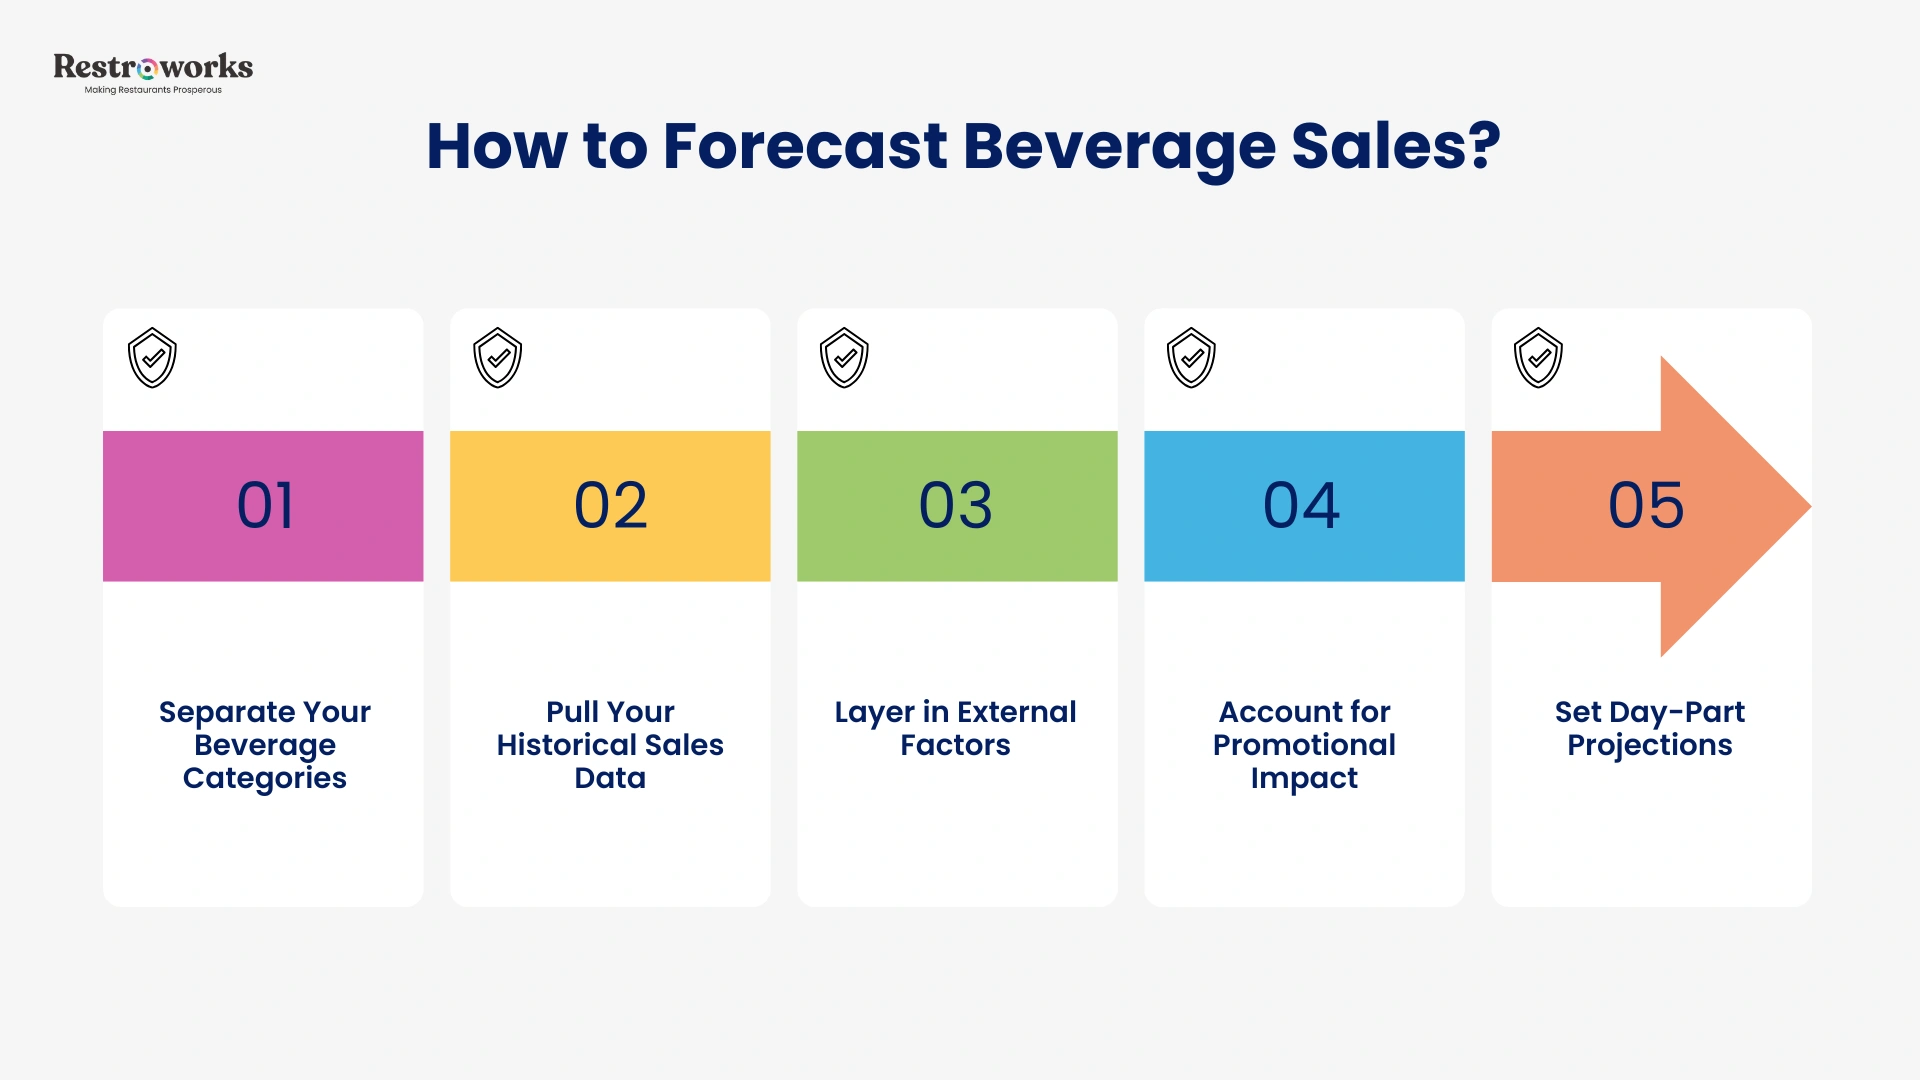
Step 1: Separate Your Beverage Categories
Don’t forecast “drinks.” Forecast:
- Beer (draft vs. packaged)
- Wine (glass vs. bottle, red/white/sparkling)
- Spirits and cocktails
- Non-alcoholic (coffee, juice, soft drinks, premium zero-proof)
Each category has its own seasonal patterns, its own attach rates, and its own response to external factors. Don’t mix it all together. Blended forecasting obscures the customer patterns that actually drive your purchasing decisions.
Step 2: Pull Your Historical Sales Data/Past Sales Data
Historical sales data is your most honest guide, let’s say. So, go back at least two years, and look at:
- Average sales per beverage category by day of week
- Category mix ratios (what percentage of drink revenue each category generates)
- Seasonal trends – when were the peaks and valleys?
- How actual sales responded to promotions, events, and weather shifts
Using past sales data to identify patterns helps restaurants predict busy periods and future sales with greater accuracy. Layer it with a point-of-sales, and it will provide sufficient data to accurately predict sales without requiring additional external data sources (ScienceDirect, 2022).
The point is you don’t need to buy expensive data. You probably already have what you need – it just hasn’t been pulled and analyzed systematically. Forecasting restaurant sales from your own POS history is the single most cost-effective method for restaurant owners.
And here’s why historical data matters much, much more than just projecting drink orders: forecasting based on historical data can provide insight into food and labor costs, helping restaurants make essential decisions about resource allocation. That means your beverage forecast directly feeds into how you manage food costs (garnishes, mixers, prep ingredients), labor costs (bar staffing by shift), and ultimately your overall cash flow position week to week.
Step 3: Layer in External Factors & Seasonal Trends
Check the calendar. Check the forecast. Note every local event in your trade area for the coming four weeks. Build a simple multiplier into your projected sales for event days. Best case, start with +20% and refine based on performance over time.
External factors such as weather, local events, and holidays can significantly influence drink demand forecasts. Local events can dramatically affect customer traffic and should be factored into your forecast data.
Mind that weather-based beverage modeling doesn’t need to be complex. For example, you can set conditions like: if the temperature goes above 35 degrees Celsius, trigger a X% increase in sales of cold drinks, or if it falls below 10 degrees Celsius, trigger a Y% increase in sales of hot drinks.
Most important – Set these thresholds based on your historical sales and keep adjusting them over time.
Step 4: Account for Promotional Impact
Events like happy hours, cocktail specials, and wine bottle promotions have a big impact on forecast data. That’s why you MUST tag them in your records.
For example, if you’re reviewing past sales, mark the week where promotions were running, so that later, when you review historical sales, you can easily see whether the demand grew organically or a temporary campaign caused that lift.
This way, when you’re projecting sales forward, and if a particular promotion is expected to repeat, you can apply the documented lift.
This is called promotional tagging, and it’s really important for protecting profit margins. Because if you don’t separate promoted-week performance from standard-week performance, you’ll likely overorder inventory and misallocate labor costs.
INDUSTRY INSIGHT
Try to build these seasonal patterns into your inventory projections quarterly, because, believe it or not, getting your inventory needs right by season is one of the best things you can do before beverage forecasting. Why? When you’re ordering for the coming season, your historical data from the same season two years prior (with the same concept) will help you with better resource planning. If you’re preparing for the upcoming summer, for example, look at what happened during the last two summers. What sold faster? What slowed down? Which categories suddenly spiked once the weather changed?
Seasonal planning also directly affects labor forecasting. Higher drink volumes during summer eventually mean you’ll need more bar staff during peak shifts. Plus, there’ll be longer tickets, and overall, you’ll need to do more prep.
A good seasonal forecast prevents that.
It lets managers align labor scheduling with expected demand early instead of constantly trying to “fix” the problems afterward.
And please, keep this one thing in mind: accurate labor forecasting is probably one of the highest-ROI habits a restaurant manager can build because, if not, labor mistakes become expensive very, very fast
How Should Your Tech Stack Look for Beverage Forecasting?
Forecasting tools range from free to enterprise. Here’s where to start based on where you are.
Starting out (manual + basic tools): At first, many operators use spreadsheet templates (Google Sheets or Excel) to run their initial restaurant forecasting. And trust us, this works very well. It also makes it easy to connect your accounting software for a clearer view of how projected sales align with actual cash flow.
Yes, it requires discipline and weekly review, but the inputs (pull historical sales, layer in events and seasonality, set your drink and food revenue targets) are all manageable manually.
For mid-size operations, tools like Zip Forecasting (quick, accurate forecasts with minimal setup), SlickPie (AI-led forecasting + accounting), Zoho CRM (guest behavior and promo tracking), Restroworks, etc., help control food costs and labor costs, refine pricing, and align demand with execution. Many of these platforms now incorporate machine learning to improve forecast accuracy over time and adjust automatically as your sales patterns shift.
Some of these tools also connect to enterprise resource planning systems, which is particularly valuable for restaurant groups managing inventory management and labor forecasting across multiple locations simultaneously.
At the enterprise level, you can check out SAP Analytics Cloud, IBM Planning Analytics, Workday Adaptive Planning, etc. These platforms are built for restaurant operations at scale, enabling market analysis, multi-location forecasting, and integration across finance, procurement, and HR in a single system.
Very, Very Important: You don’t need the most expensive tool, nope. Instead, you should figure out which one is “right” for your volume (and it can literally be a spreadsheet, no one will judge!) + Have the discipline to commit to restaurant forecasting, and you’re sorted.
How Do You Break Even & Protect Profit Margins Through Beverage Forecasting?
Break-even point = Fixed costs ÷ (Average price per unit − Average cost per unit)
For beverages, this matters because margins vary dramatically by category.
A house wine at $9 per glass might carry 80% margin. A specialty cocktail at $16 might carry 75%. A craft beer at $8 might carry 65%.
Which categories you push in slow periods (and which you promote in peak periods) should be informed by your forecast of customer demand, your profit expectations for each category, and your knowledge of which categories maximize margins most effectively.
Accurate restaurant forecasting helps restaurants prepare for seasonal fluctuations in demand by accounting for those outside influences. It also directly enables you to manage cash flow across the month. Forecasting sales accurately means you’re never caught off guard by a slow week. When you know a slow week is coming (say, the week after a major holiday), you can time your purchasing to preserve cash, plan your inventory needs ahead of time, and schedule labor conservatively, which directly controls variable costs on both the food and labor costs side, and tightens inventory management across your bar program.
Accurate forecasts also enhance financial management by providing clearer insights into future revenue and expenses. Restaurant owners who build even a basic weekly forecast consistently report better control over cash flow, fewer inventory surprises, and more predictable profit expectations quarter over quarter. For long-term business growth, that consistency compounds as each accurate forecast cycle builds a stronger data foundation for the next. That’s the compounding return of disciplined sales forecasting, and why forecasting sales accurately is worth every 30 minutes you invest weekly.
Variable costs in beverage operations (which are primarily the cost of goods) can be tightly managed when you accurately forecast sales. Inaccurate projections lead to either over-purchasing (wasted cash flow) or under-purchasing (missed revenue).
Plus, forecasting based on historical data can provide insight into food and labor costs, helping restaurants make essential decisions about resource allocation. That includes food and labor costs on the beverage side, like the bar staff wages, the garnish and prep costs, and the waste from expired product.
What Happens When Your Forecast Is Wrong?
Let’s be honest for a second because I think restaurant operators sometimes put way too many expectations on forecasting, as if it’s some kind of magical wand that will make data perfectly accurate and predictable.
That never really happens.
Forecasts are always going to be somewhat wrong. Sometimes very wrong, and sometimes even embarrassingly wrong. And honestly, I think the entire point here is not to become “perfect” but to be wrong in smaller, more manageable ways over time.
That’s how forecasting accuracy improves over time. Not by aiming for perfection on day one, but by reviewing what actually came in against projections every week and adjusting.
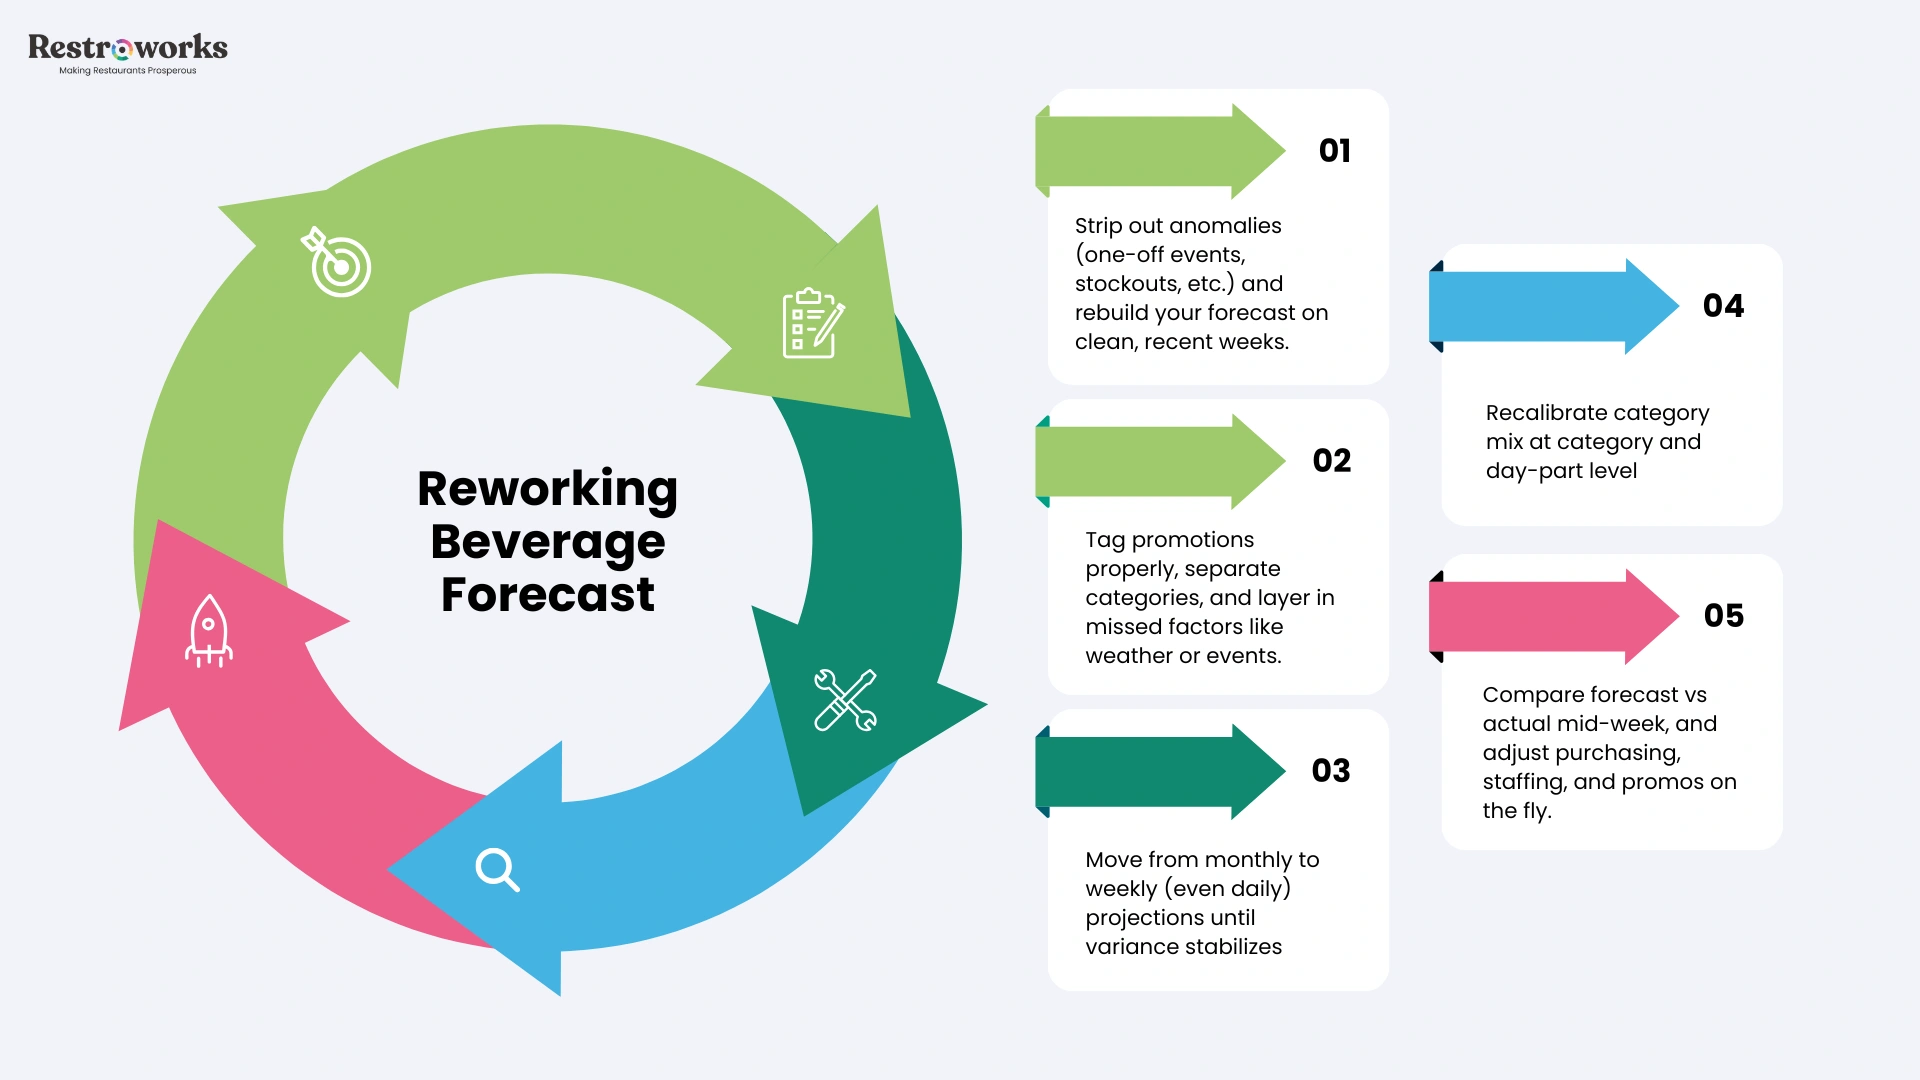
So, when should you rework your beverage forecast? When –
- Actual sales deviate from projected sales by more than 15% for at least two consecutive weeks.
- A new competitor opens nearby.
- You launch a new menu or remove a popular drink from your menu.
- Economic conditions shift due to inflation, unemployment, market trends, or other factors.
- Your concept evolves (brunch service, late-night hours, a bar takeover)
If there’s a consistent gap between expected and actual results, it usually means you need to reassess your approach to sales forecasts. How can you do that?
Remember:
Forecasting gives restaurant operators the clarity to plan ahead instead of reacting in the moment.
That clarity comes from your sales history, your historical data, and whether you can actually set aside just 30 minutes out of your week for the forecasting process.