It’s 2026, and the world is turning into a scorching furnace with temperatures pushing past 45°C across multiple regions. Something similar (though less intense) happened in 2024, too, and the restaurants, as a result, faced at least a 40% drop in footfall.
What does this mean – we just forecasted an inevitable demand dip for restaurants this summer.
Now, if we try to count factors that drastically impact customer flow/demand, the weather will come first. There are several others, too, that we’ll discuss in the article. But the main question is whether those shifts catch operators like you off guard, or if you see them weeks in advance and adjust head-on.
The latter is why forecasting slow periods in restaurants makes sense.
In fact, accurate restaurant forecasting helps restaurant operators/owners and managers:
- Predict sales and customer preferences
- Rework their customer experience strategies
- Improve inventory management
- Maintain customer satisfaction
- Make overall informed decisions around how they’ll manage the period, protect profit margins, who will do what, etc., etc.
More importantly, forecasting future sales gives restaurant owners a clearer picture of cash flow, staffing requirements, and operational risks so they can maximize profitability while building towards sustainable growth.
Sales forecasting is one of the most underleveraged capabilities in the restaurant industry, and the operators who get it right tend to stay in business far longer than those who don’t. Let’s get right in!
What You’ll Learn
- Why do demand dips often follow a predictable pattern & how can restaurant owners use tha information in their favor?
- How can you use sales-related information to build forecasts you can actually act on?
- How should you adjust your labor costs, inventory, and cash flow before footfall slows down?
- How does accurate forecasting improve restaurant operations, financial management, and operational efficiency?
How Can You (& Why You Should) Identify Patterns that Slow Periods in Restaurants Follow?
So, data has it that Mondays and Tuesdays are the slowest days of the week for most existing restaurants. Plus, as for the month, January and February are the slowest because people have just taken a breather after long holidays, and most are trying to stick to their New Year’s resolution of not eating out and budgeting better.
August is somewhat slow as well, but for completely different reasons, as in families, at this time around, take vacations and cities empty out, so you kind of lose your regular footfall.
Now the problem with most restaurant operators is that they KNOW when exactly demand is going to drop and still haven’t built a system around it yet.
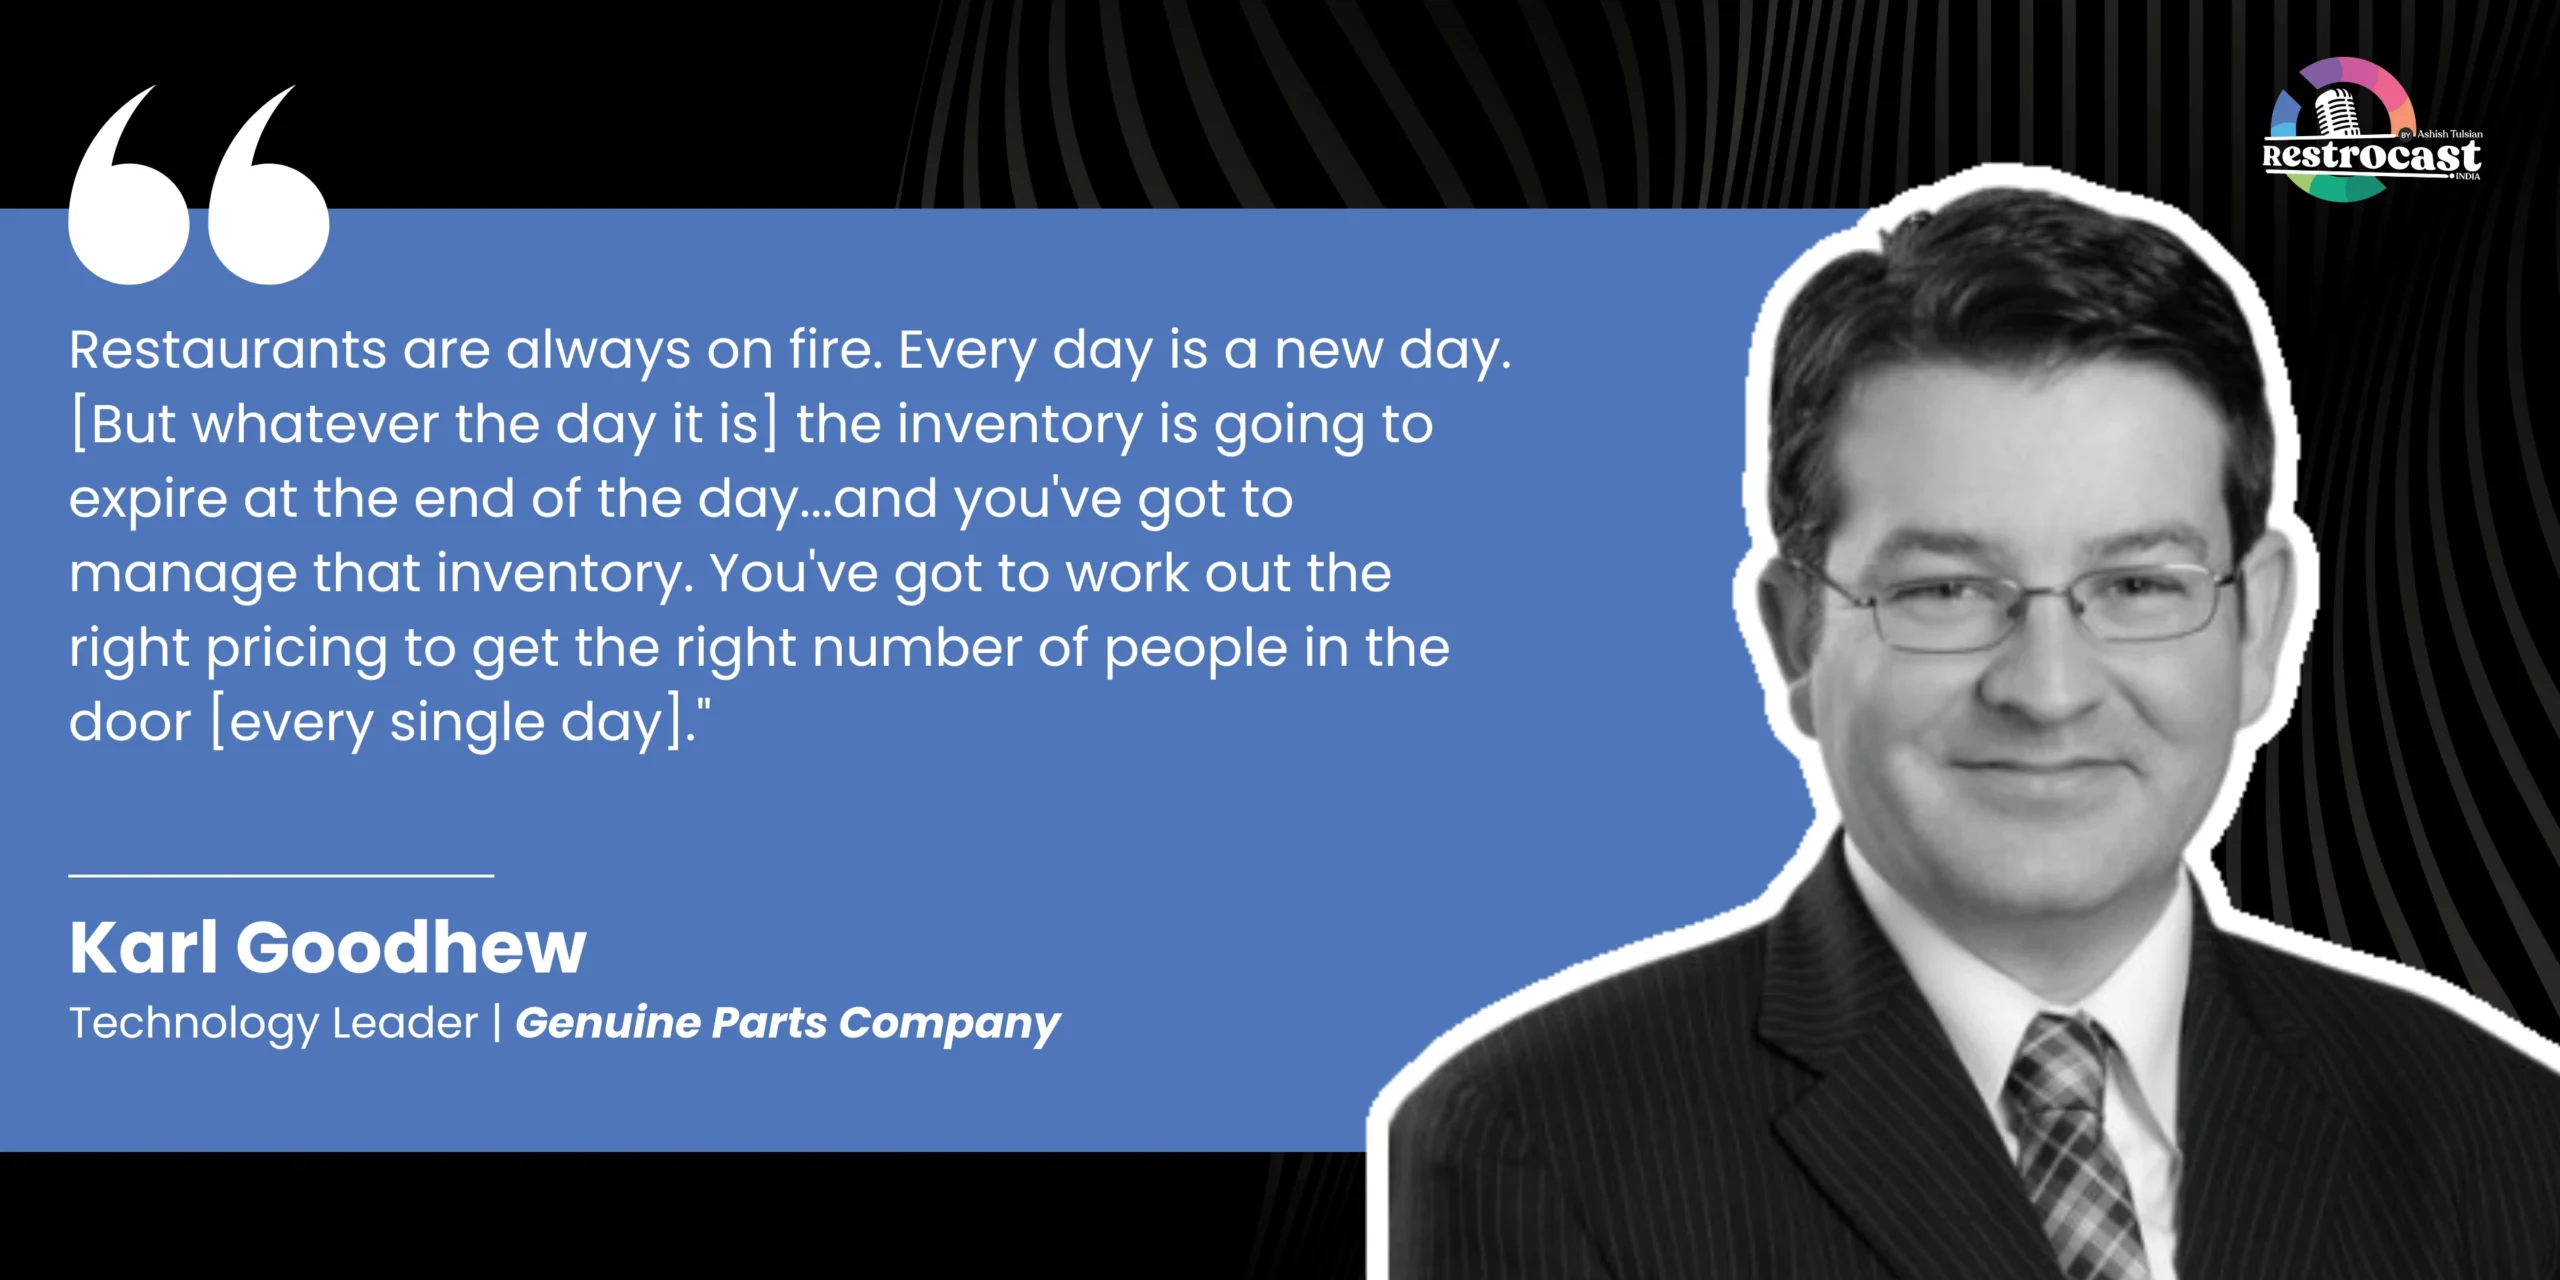
Karl Goodhew, speaking on the Restrocast podcast, captured the stakes well:
INDUSTRY INSIGHT
According to St. Louis Federal Reserve data, restaurant sales tend to increase by an average of 19.3% between January and July. They then drop roughly 10% through winter.
Again, that’s predictable, and you’ll still “forget” to adjust your labor, inventory, and cash flow.
Think about it – if you run 50 excess labor hours per week during a slow month at $15–20 an hour, the cost will come somewhere around $3,000–$4,000 in monthly waste per location. On a 3–5% net margin, a 10% revenue dip is by no means a deal you’d want to make sober.
On the other hand, just cutting perishable par levels by 20–30% during forecasted slow weeks can recover $1,500–$3,000 a month in spoilage. Best part? You recovered that money without changing your menu even a bit.
Accurate forecasting can help restaurants reduce food and labor waste by up to 15% by aligning operations with demand. Restaurants that implement effective forecasting can achieve cost savings of approximately seven dollars for every dollar invested in improved inventory management and ordering practices.
Forecasting traffic dips allows management to proactively manage cash flow, eliminate food waste, and optimize labor costs. Accurately predicting lulls allows operators to protect the bottom line by optimizing labor costs and minimizing food waste.
That’s the value of accurately forecasting restaurant sales. It helps you anticipate customer expectations instead of reacting after loss has already happened.
The Types of Forecasting & How Exactly Should You Implement Them?
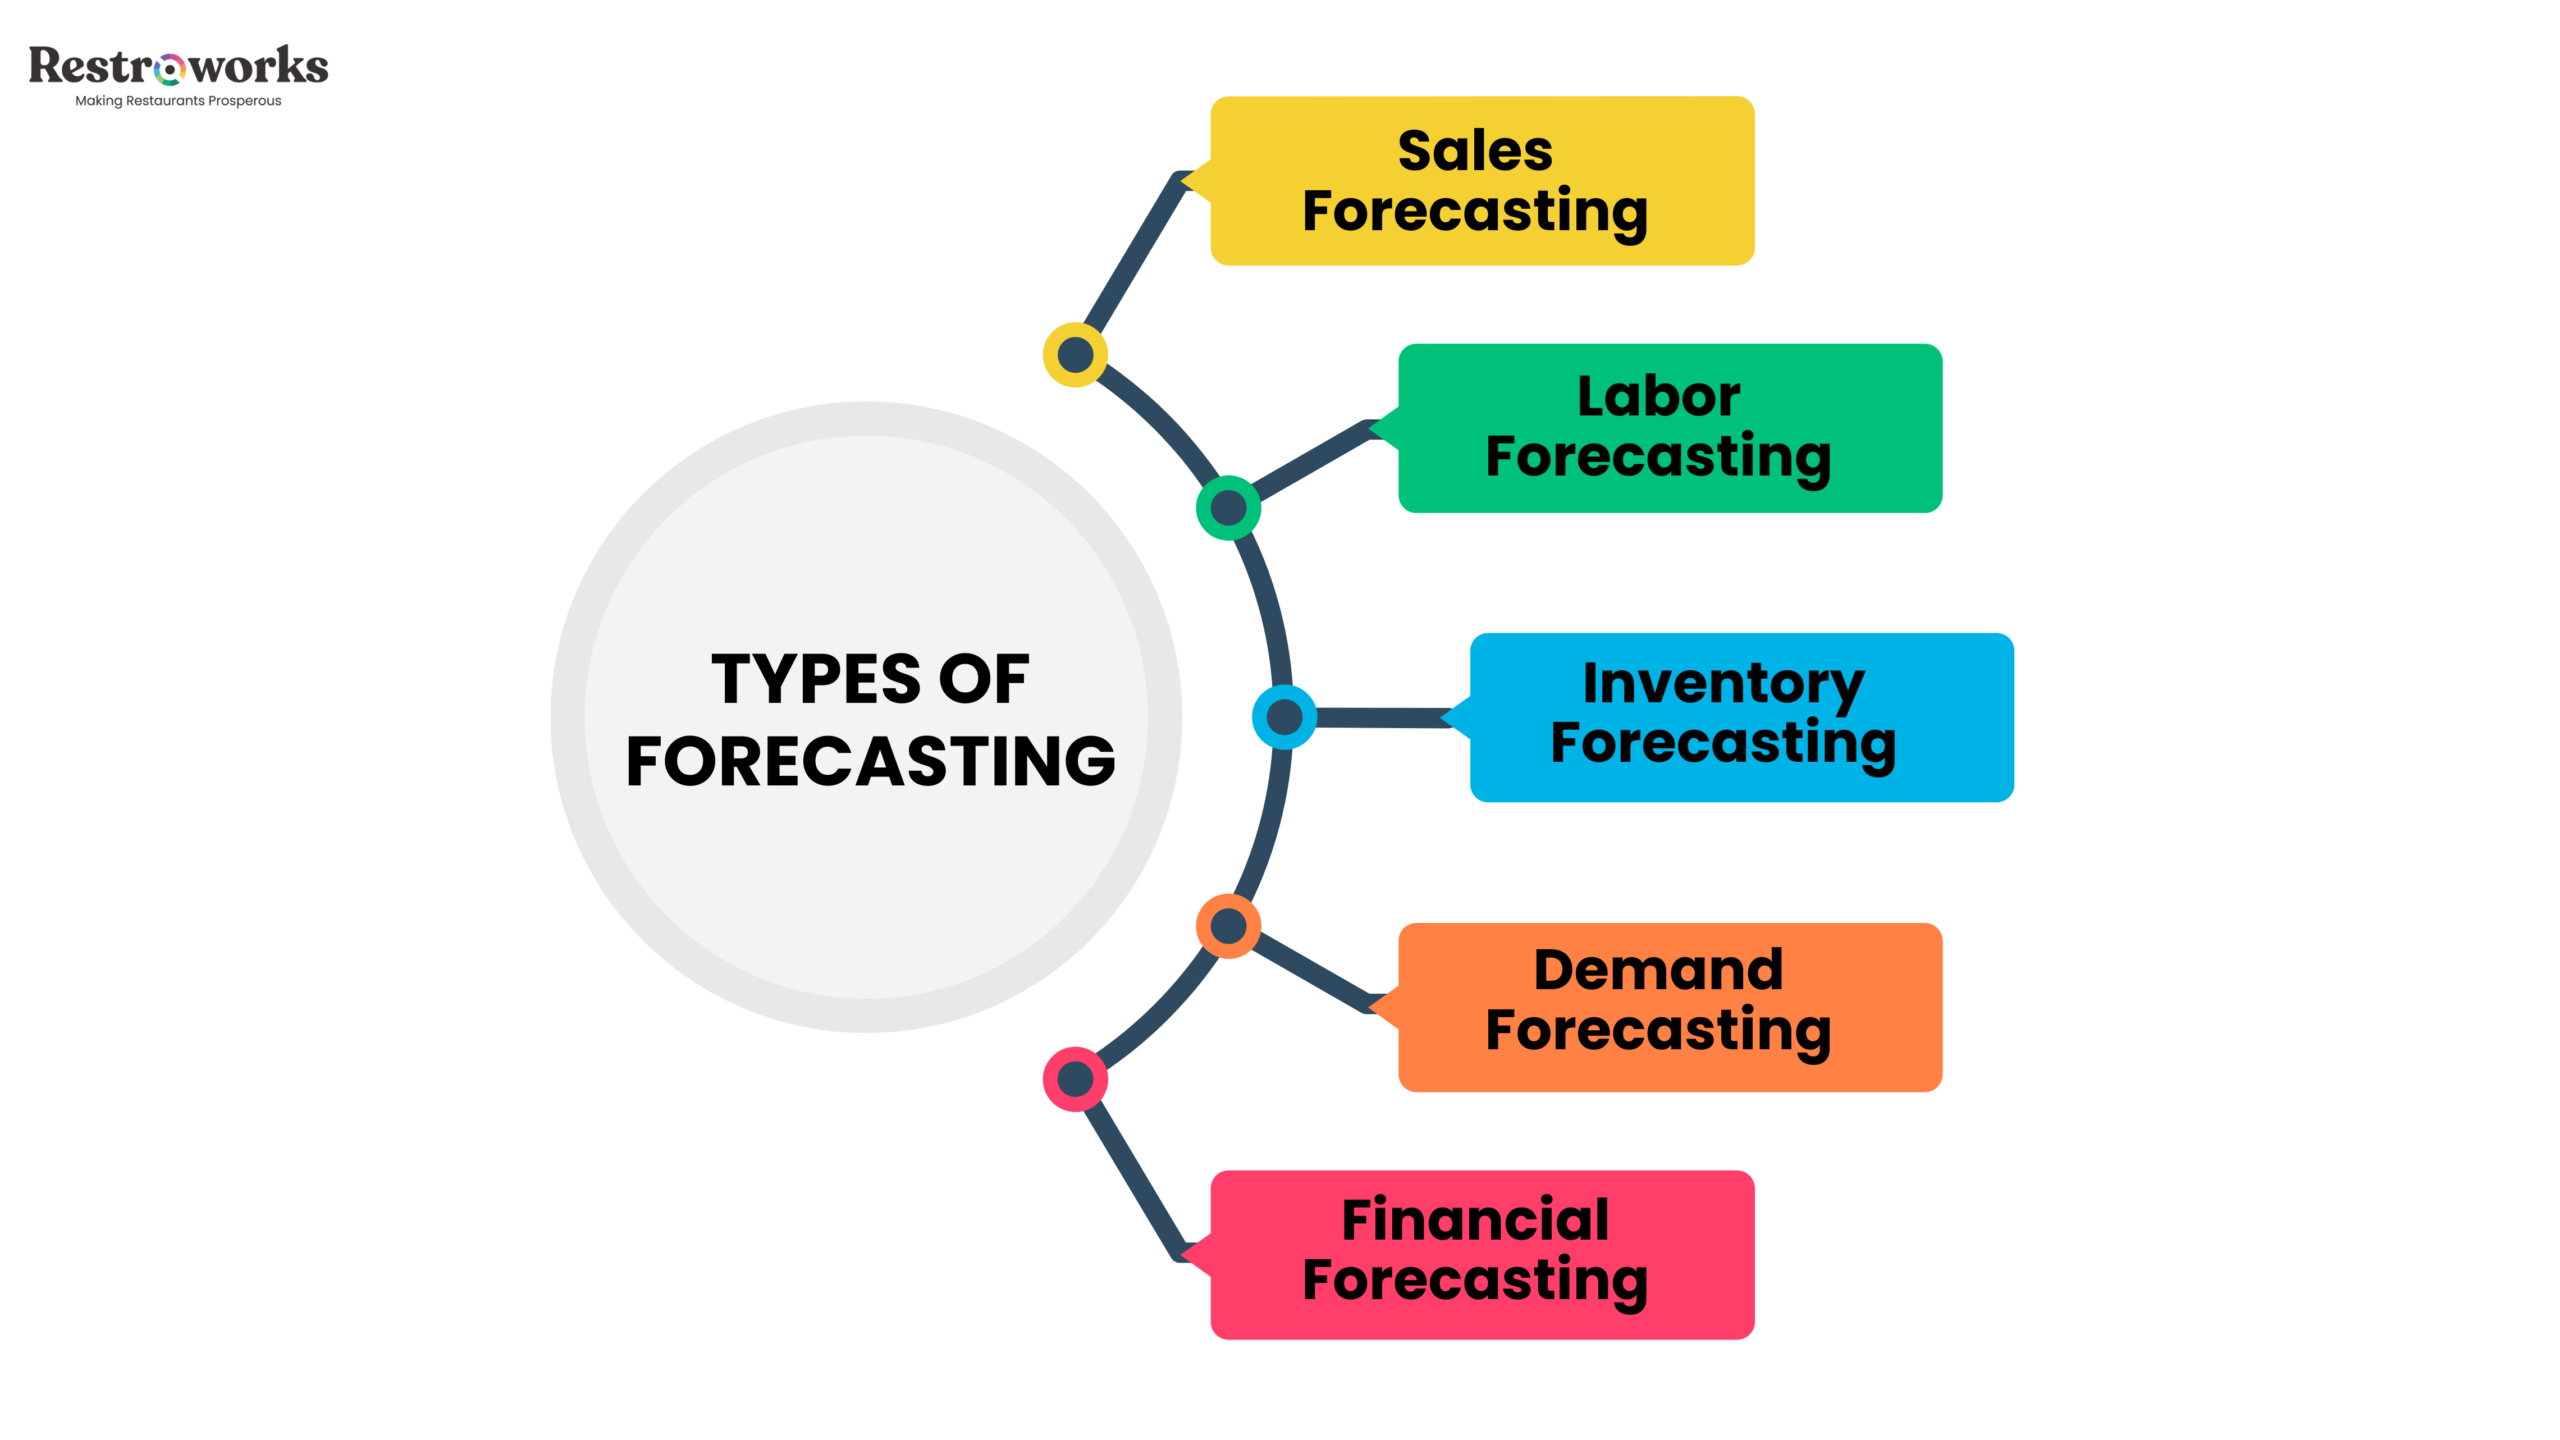
When we talk about restaurant forecasting, we usually cover these five parameters, and each type of demand forecasting feeds the next, and together they form the backbone of how successful restaurant owners manage both expected demand and sudden shifts:
Sales Forecasting – It gives you a projected sales and future revenue that you might expect to make within a particular (or X or slow) period. Basically, how much are you likely to sell in August? This number comes as you analyze your past sales, market trends, and various external factors like weather, local events, etc.
Labor forecasting – After your expected sales volume, you take that projection and work backward to determine your staffing needs. Like, staffing forecasts tell you exactly how many servers, tenders, or kitchen hands you need on any given shift. This is demand forecasting applied directly to your headcount, and it’s a super simple way to avoid the twin traps of overstaffing during quieter hours and running short during a rush.
Inventory forecasting – Next, what you do is adjust ordering and par levels to match projected sales. This way, you will ensure you neither over-order nor under-order in any circumstance. So, basically, with inventory forecasting, you reduce food waste and protect yourself against rising food costs by only purchasing what demand forecasting tells you will actually sell. Effective restaurant demand forecasting simplifies inventory management, helping you avoid over-ordering and running low on key items by using past data, trends, and market conditions.
Demand Forecasting – Here, you anticipate three things: how many customers will show up, what they will likely order, and when they will show up. The goal is to predict sales and spend patterns accurately enough that your accurate forecasts drive every downstream decision from there on, be it the number of staff on a shift or the items you order from your supplier. Understanding customer behavior this way allows restaurants to adjust menu planning, staffing, and service standards to meet customer demand more effectively.
Financial forecasting pulls all the above data together and charts your cash flow, expenses, variable costs, etc., during the X period. Like how will you cover the fixed costs during the slow period, whether a credit line draw is likely, and at what level exactly will financial pressure kick in? This gives restaurant owners better visibility into financial pressure points and supports stronger financial management throughout the year.
82% of restaurant business failures are attributed to poor cash flow management or a lack of understanding of cash flow dynamics, highlighting the importance of accurate forecasting for financial health.
Effective restaurant forecasting involves analyzing sales to identify patterns and trends, which can inform decisions about staffing, inventory, and budgeting.
That said, here’s how restaurant owners and managers can build a restaurant forecasting process and better align it with their labor, inventory management, and cash flow needs:
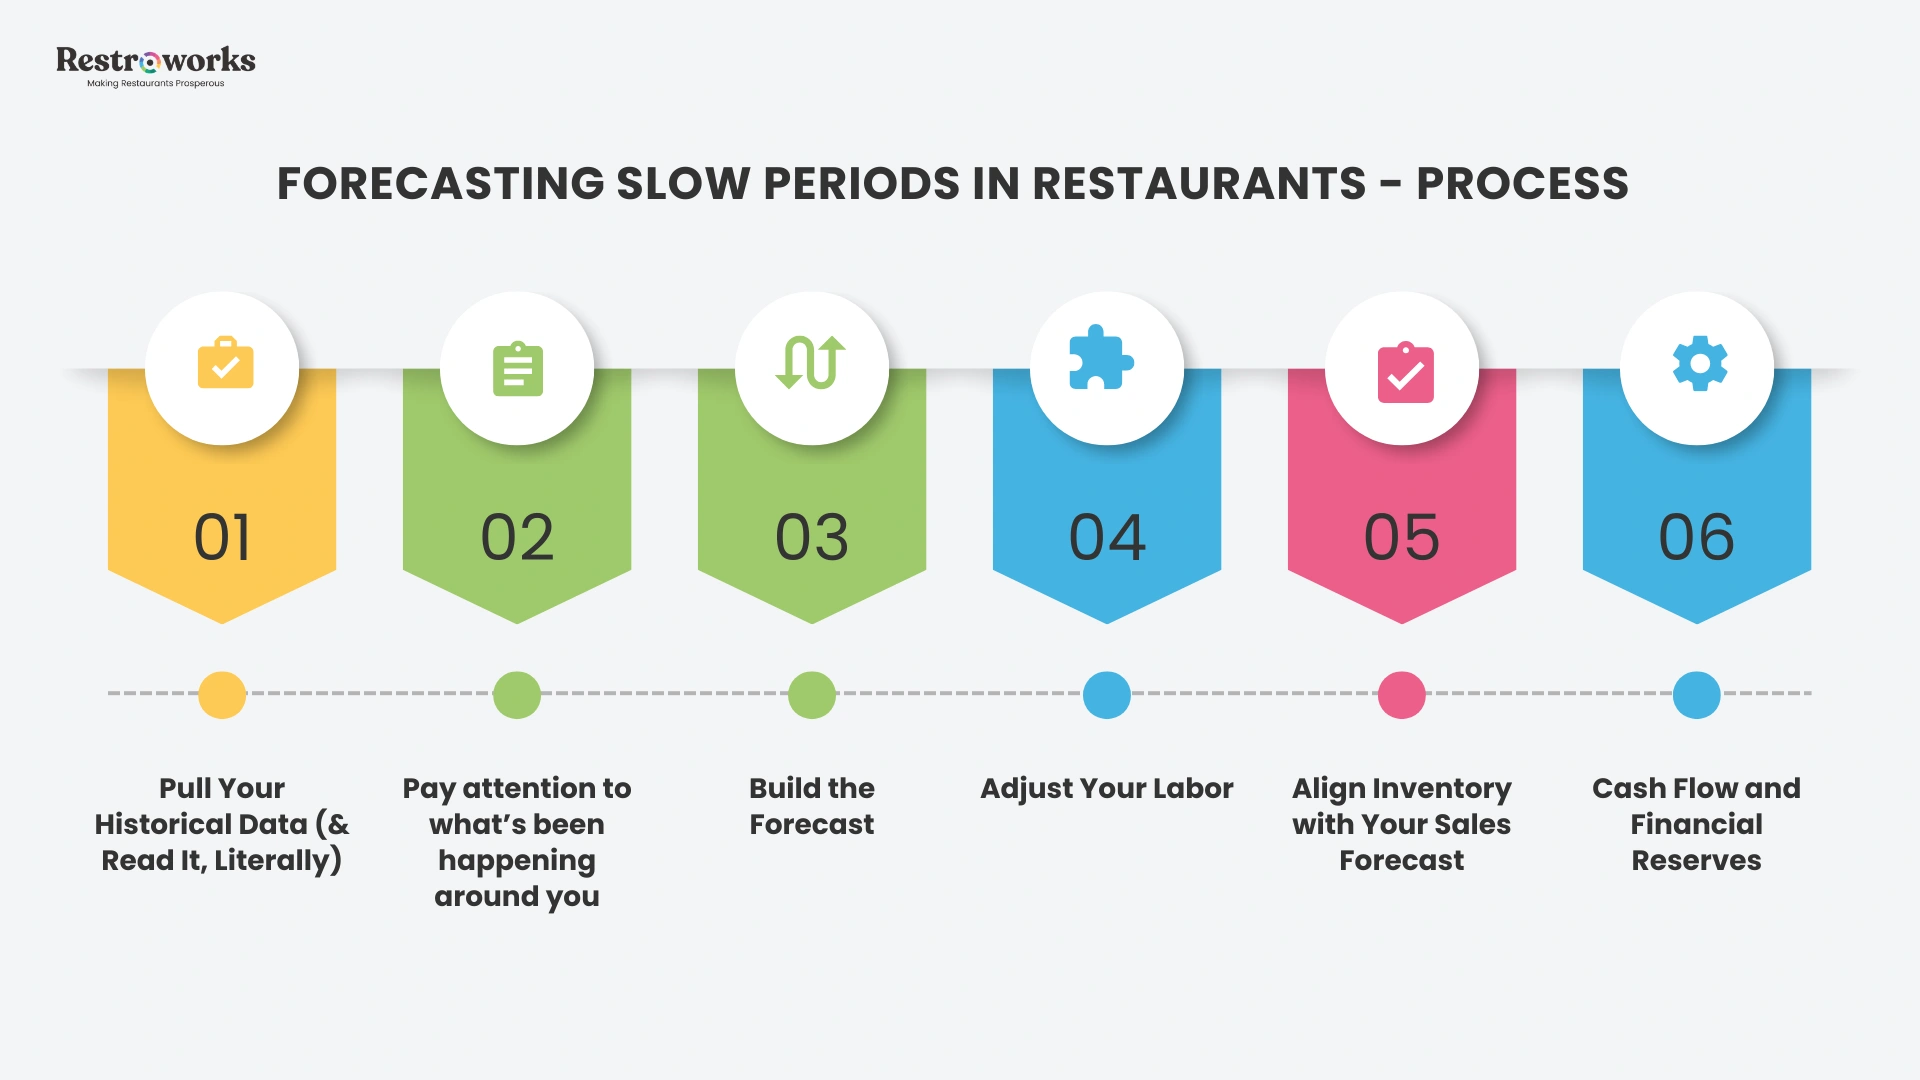
Step 1: Pull & Analyze Historical Sales Data (Read It Through and Through, Literally)
For accurate restaurant forecasting, you’ll need to pull in your past sales data. From where? Check your POS system. It’s the single best source to forecast restaurant sales at the granular level you need. There you’ll likely find the numbers broken down by day, week, and ideally by daypart.
When digging through your past sales data, look for:
- Which weeks of the year saw the sharpest drops compared to your baseline?
- Are those drops consistent year-over-year, or do they shift based on external factors?
- What does your average slow week look like in terms of demand, revenue, and check size?
- What were food and labor costs like during those periods?
Analyzing historical sales data is crucial for identifying seasonal trends, which can help inform future forecasts and improve operational planning. Analyzing sales from the same week or month in previous years helps in finding recurring seasonal trends.
Now you may want to know exactly how much of the data you should look into. Go for twelve months at a minimum. 2-3 years are even better as they will give insight into whether a particular dip is a seasonal pattern or one of the one-off market trends. Averaging sales from the past 3 to 4 weeks can help predict immediate upcoming volume.
Once restaurant managers can see such patterns, forecasting future sales becomes significantly easier, which again serves as the foundation of solid sales forecasting. Now, you can establish a baseline:
- How many covers on average do you receive on slow days/weeks?
- How much money do you make during that period?/ Or how much do you sell?
- How many staff members do you need on the ground?, etc.
So, next time a comparable event happens, you have an anchor for labor scheduling, inventory orders, and cash planning. Restaurant sales forecasting built on this kind of baseline allows you to produce accurate forecasts and predict future sales with much greater confidence.
“Companies that aren’t good at budgets aren’t good at predicting the future. If you’re not good at predicting future demand, the business can sometimes be an accident.”
|
Step 2: Map Local Events and Seasonal Trends to Forecast Customer Behavior and Boost Profit Margins
“Gemini, What Does My Customer Demand Right Now?” Works, but Gemini might not know that a parade is going to block your parking lot for a day, and thus, your customer traffic is going to be much lower. That’s why restaurant sales forecasting still requires human judgment.
Basically, look for:
Local Events – like a nearby festival, conferences, a parade – anything that might spike or suppress your restaurant’s footfall. Mark them in your calendar, and maybe color-code the events that are likely to slow down your future sales and overall workflow with red. Local events such as festivals, concerts, and sports games can greatly influence restaurant sales, either by increasing customer traffic or causing disruptions that reduce footfall.
Next comes seasonal variations. These are the most predictable external factors. If your restaurant is near an office or school, you’ll likely experience a slower period in June, when students have their summer break. But if you run a coastal seafood spot, summer will bring in more customers. Seasonal patterns significantly affect restaurant sales, with warmer months often increasing foot traffic and colder months boosting delivery orders, necessitating adjustments in staffing and inventory. Recognizing such patterns is essential for accurate forecasting.
Then, there are economic signals. Nearly half of U.S. adults said in 2025 they weren’t eating out as often as they’d like because of “cost.” Economic conditions, including inflation and employment rates, can impact consumer spending behavior in restaurants, affecting average ticket sizes and overall sales. When disposable income is tight, customer behavior is impacted, and so casual restaurant visits drop faster. If your customer base is price-sensitive, these demand dips may run for a much longer time than your historical data could ever suggest.
Competitor activity determines the state your restaurant is going to be in for the particular period and beyond. A nearby competitor opening, closing, or running an aggressive promotion will show up in your restaurant sales data.
Brands that incorporate external factors like weather and local events into their restaurant forecasting can improve accuracy and better align their operations with actual demand. Factoring in even basic local market research (in a way that helps you identify trends early) yields more accurate forecast data and ensures you make informed decisions at the end of the day.
Step 3: Build & Set Accurate Forecasts Using Past Sales
Honestly, the overall mechanics of building an accurate forecast aren’t that complicated once you have the data.
The weighted average method can be a good starting point. This says – Give more weight to recent historical data, since your restaurant today reflects your last six months more than it did two years ago.
A reasonable approach is to weight the most recent year at 50%, the year before at 30%, and two years back at 20%. Apply those weights to the same period’s sales figures, and you have a starting projection. This creates more accurate restaurant sales forecasts because it reflects current customer behavior and market trends more realistically.
Next, adjust for known variables. If you know that a local event will suppress footfall, apply a downward modifier. If you’re running a promotion that reliably drives covers, build that in. The more honest restaurant owners are in incorporating external factors like seasonal fluctuations, the more accurate your restaurant sales forecast will be.
Predictive AI uses machine learning algorithms and external data to project revenue and traffic with high accuracy. With AI layered into your restaurant forecasting models, you can expect 95%+ accuracy in your restaurant forecasting.
Here’s the basic formula for sales forecasting at the unit level:
Projected covers × average spend per cover = projected revenue
Track your average spend carefully over time. It’s one of the most reliable indicators for calibrating your forecasted sales week over week. From the projected future revenue you just calculated, derive your target labor cost percentage, your food order quantities, and how much revenue you’ll actually make during the period. Demand forecasting at this level of precision means every cost line becomes deliberate instead of reactive. When your accurate forecasts are grounded in this formula, you protect margins on both ends.
Step 4: Adjust Your Labor Costs (Just Do It)
Labor is the highest controllable cost in most restaurants. But due to poor labor forecasting, operators often have to deal with either excess payroll or understaffing at the most crucial moments.
Good restaurant forecasting helps you avoid both by matching your staffing curve to your demand curve. When sales trends by daypart are the input, your labor schedule is the output.
Accurate forecasting helps restaurants align staffing levels with projected sales, allowing them to schedule the right number of employees and reduce both overtime and understaffing issues.
A few practical ways around if you ever find yourself stuck are:
- Cross-train staff so you’re not locked into rigid role assignments. This way, when volume drops, one or two staff members can actually handle the entire floor.
- On the flip side, build a short list of part-time staff who can fill gaps quickly if your forecast runs light. Like you might have forecasted, you’ll need only two staff members on Tuesday because there will be a parade going on, and the streets will be blocked. But it might happen, people come to rest at your restaurant during that blockade, and so you’ll suddenly need more people to handle the job. So, call your part-timers.
- Stagger start times so your labor presence mirrors your anticipated customer traffic by hour. Benchmarking historical staff costs against hourly revenue identifies precise times of day when the floor is overstaffed.
Most importantly, involve your team in the restaurant forecasting process early. Have honest conversations with them before the slow stretch, not during it. Collaboration improves accurate forecasting and increases accountability across the board.
A useful benchmark: track Sales Per Labor Hour (SPLH). For full-service restaurants, a healthy SPLH target falls in the range of $35–$50 during peak periods. During the forecasted dip, your scheduling should reflect adjusted demand and not just default to the regular pattern because it’s familiar. Integrating data with software platforms allows managers to match labor needs exactly to projected demand, minimizing overstaffing.
“Slow times are for grassroots marketing. Go local with something around your community.”
|
Managing busy and slow periods includes scheduling deep cleaning, optimizing staffing, and implementing demand-building promotions. Daypart Analysis breaks the operating day into specific blocks to isolate weak shifts. Together, these two practices ensure you’re not just surviving the dip but actively using it well.
Step 5: Align Your Inventory Needs and Average Spend with Your Inventory Forecasting Data
Inaccurate forecasting during low-traffic periods means your perishable food will sooner or later end up in the trash. Not only that, but if you order for a normal week during a forecasted slow one, your food cost percentage will naturally be high, and your profit margins will sink.
Effective inventory management, guided by accurate sales forecasts, helps restaurants avoid over-ordering and running low on key items, ensuring they meet customer demand without excess waste.
So, this is how restaurant operators should cascade their forecast into ordering:
- Calculate your projected revenue for the slow week.
- Multiply it by your target food cost percentage to get your food cost budget.
- Use menu mix data from comparable quiet stretches to estimate what will actually sell
- Finally, set par levels from that expected demand.
For perishables, timing matters most.
And this is where supply chain visibility becomes critical. You need to know your lead times, your vendor minimums, and where flexibility exists so inventory levels can flex with your forecasted demand. With rising food costs putting pressure on margins across the restaurant industry, demand forecasting that reduces food waste becomes a financial necessity.
We also advocate considering restaurant forecasting software. It helps you manage inventory needs by aligning stock levels with projected sales while reducing shortages and spoilage.
More importantly, accurate forecasting helps restaurants meet customer expectations consistently without compromising service quality. And when customers expect a certain experience (fresh ingredients, short waits, & consistent menu availability), your inventory management is what delivers or fails to deliver that promise.
Remember: You’re not cutting orders arbitrarily. You’re cutting them because the restaurant sales forecast tells you what customers expect to order/buy. Getting this right will protect profit margins on both ends: no over-buying that ends in the trash, no under-buying that leads to mid-service 86s.
Step 6: Cash Flow Management and Financial Planning Before the Dip Hits
Okay, this is something you’ll have to take care of much before the actual slowdown happens. For effective cash flow management –
- First and foremost, build an emergency buffer. All you need to do is, during peak months, set aside two to three months of fixed operating costs. Your fixed costs are your rent, utilities, insurance, and base payroll. Keep this amount in a separate bank account if you want.
- Pre-approve a line of credit while business is healthy. Banks (and of course no one) don’t love lending to restaurants currently in trouble.
- Use your weekly sales forecast to project cash positions through the dip. Know in advance which weeks will be tight for payroll and vendor payments, and make decisions while options still exist. Restaurants that regularly forecast their sales can improve financial planning and cash flow management, which is crucial as 82% of restaurant business failures are attributed to poor cash flow management.
Always and always remember: Weekly sales forecasting allows early course corrections. Spotting a cash gap two weeks out gives you room to push a promotion, adjust an order, or defer a non-critical purchase. These things go out of hand once you’re already in the dip.
In all, a disciplined forecasting process allows restaurants to identify operational challenges early and maintain financial stability even during difficult periods.
What Forecasting Tools & Supply Chain Integrations are Worth Using?
The right forecasting tools make the process faster and more consistent. They don’t change the underlying principles, but they dramatically reduce the manual burden of accurate forecasting.
A modern POS system already captures most of the data you need. Many now include basic restaurant forecasting features like weekly sales trend reports, daypart breakdowns, and menu mix analysis. A proper restaurant management system that integrates your POS data with labor and inventory modules gives you a unified view of how forecasted sales translate into operational decisions. Trust us- If you’re not running and going through those reports regularly, that’s the first fix, and it costs nothing extra.
But then comes purpose-built restaurant forecasting software. These forecasting models layer external signals — local events, weather, competitor activity — on top of your sales history to produce more accurate sales forecasts and forecast restaurant sales at scale. Analyzing historical sales data, tracking local event calendars, and monitoring seasonal weather shifts are effective strategies for forecasting lulls.
Event and Trend Mapping factors in community calendars and local business schedules to anticipate foot traffic drops. These forecasting tools are especially valuable for multi-unit operators who can’t monitor every location personally. Forecasting software that integrates directly with your POS can automatically pull data, provide real-time updates, and reduce the manual work that causes most operators to skip the process altogether.
Now layer in AI to it all, and since predictive AI uses machine learning algorithms and external data to project revenue and traffic with high accuracy, now you can expect 95%+ accuracy in your restaurant sales forecasting. When demand forecasting is this precise, accurate forecasts stop being a planning exercise and become a genuine competitive edge.
Look at this example – Pressed Café, a fast-casual chain, saved over $500,000 annually by using labor visibility tools to identify exactly where overstaffing was happening by daypart. They used data to figure out the problem and forecast to take necessary action. Restaurants that effectively use forecasting can improve profitability and reduce waste by up to 15% by aligning their operations with demand, which includes staffing and inventory management.
After all, at the end of the day, restaurant sales forecasting is less about what software you use and more about how disciplined you are, how regularly you audit your data, spot patterns, and actually act on them.
Restaurant operators who consistently review sales data, refine forecasts, monitor recurring trends, and act early are far more likely to achieve long-term success.
Because trust us, having low-traffic periods isn’t that big of a deal. Not planning for them, though, is.
KEY TAKEAWAYS
- Traffic dips are predictable. January, February, and August are the slowest periods for most existing restaurants.
- Restaurants that regularly forecast their sales can lower food and labor waste by up to 15% simply by aligning their operations with demand based on historical data.
- Effective restaurant demand forecasting simplifies inventory management, helping you avoid over-ordering and running low on key items by using past data, trends, and market conditions.
- Restaurants that implement effective forecasting can achieve cost savings of approximately seven dollars for every dollar invested in improved inventory and ordering practices.
- Build your forecast from a minimum of 12 months of past sales data. If you go 2-3 years of historical data, that’s even better.
- Always factor in external factors like local events, seasonal fluctuations, and economic conditions when doing demand forecasting.
- Labor schedules and inventory orders should cascade directly from your sales projections to keep food and labor in check.
- Keep yourself financially prepared to sustain revenue dips. Build reserves, pre-approve credit, and project your weekly cash position well in advance.
- 82% of restaurant business failures are attributed to poor cash flow management, making financial planning a non-negotiable part of your forecasting process.
- Regularly reviewing forecasts against actual sales and historical sales drives accountability and continuous improvement in predicting future data.
- Continuous improvement and collaboration keep demand forecasts relevant and actionable for restaurant operators.
Frequently Asked Questions
1. How do you calculate food and labor costs percentage using the 30/30/30 rule?
The 30/30/30 rule allocates roughly 30% of revenue to food costs, 30% to labor, and 30% to overhead, leaving around 10% as profit.
To calculate your actual food cost percentage, divide the total food cost by total revenue and multiply by 100.
Basic math – If you spent $9,000 on food against $30,000 in actual sales, your food cost is 30%. You can apply similar calculations for labor forecasting.
2. Does the 30/30/30 rule work for all restaurant types?
The 30/30/30 rule is one of the industry benchmarks. It’s in no way a universal rule. Yes, you can use it, but try to calibrate it against your historical data first.
Fine dining, for example, often runs higher food costs (35–40%) because of its ingredients and service quality, offset by higher check averages. Fast casual tends to run tighter food costs.