
You plan your week based on expected demand. Expected covers, inventory requirements, and staffing levels are all aligned with the forecasted demand. But when actual demand doesn’t match those numbers, you can almost immediately see the impact.
A higher-than-expected customer traffic puts pressure on your team and affects service. A slower day means you will have excess staff and unused inventory. Over time, all this affects both cost control and consistency.
This gap usually exists because forecasts often fail to capture how demand really behaves across days, shifts, and external conditions. As a result, improving accuracy in restaurant forecasting requires a shift in approach to align them better with everyday operations.
What you will learn
- How do inaccurate forecasts affect your restaurant business?
- Key strategies to improve restaurant forecasting accuracy
- How to measure the accuracy of your forecasts
Why Traditional Sales Forecasting Methods Fall Short?
Like most restaurants, you might be following a fixed approach to sales forecasting. You look at past sales, consider the trends, factor in seasonality, and use that to estimate sales. It sounds reasonable. But it may not always hold true during actual service.
The thing is, demand is not as linear as historical analysis expects. Even the smallest of changes, in traffic, in customer preferences, or in local activity, can throw off your forecasts in a snap. Plus, you often create forecasts in advance and rarely get the chance to adjust them once the week starts.
And by then, it’s too late to fix staffing, inventory, and kitchen prep decisions. In fact, according to the 2025 Restaurant Growth Insights Report, restaurant sales forecasts average only 60% accuracy despite widespread technology adoption in the industry.
On the other hand, deep learning forecasting methods significantly improve forecasting accuracy for daily customer flow in restaurants compared to traditional statistical approaches.
Here are some of the ways traditional restaurant forecasting methods fall short-
- They rely too much on historical sales data and past patterns that don’t always repeat.
- They lack responsiveness to real-time demand fluctuations
- They average out fluctuations, which ignores the highs and lows of demand
- They don’t adapt to intra-day changes
This can lead to unreliable forecasts, which affect your everyday operations and efficiency.
The Hidden Cost of Inaccurately Forecasting Restaurant Sales
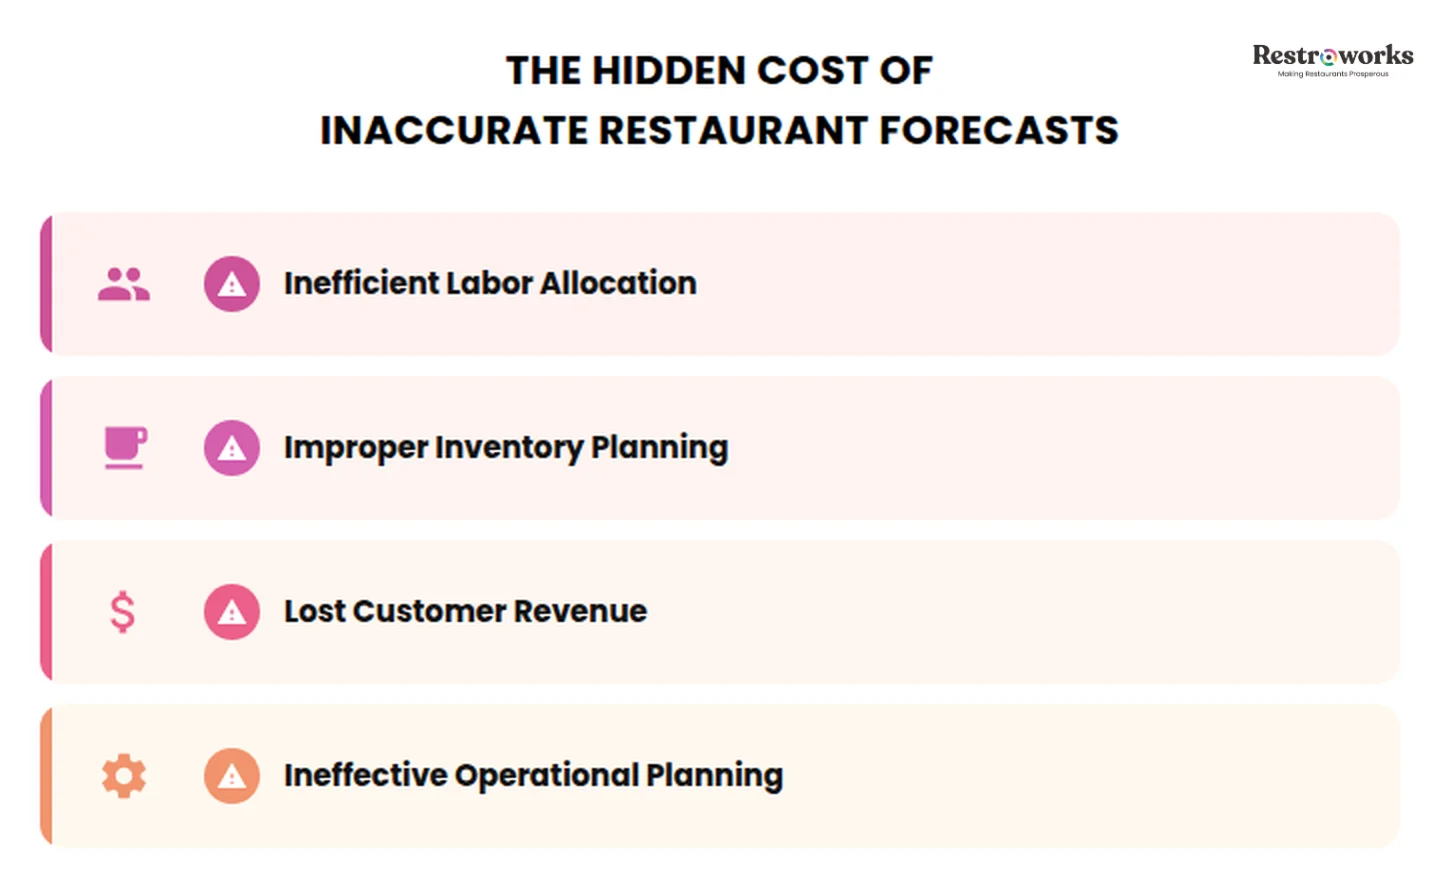
Forecasting inaccuracies don’t just disrupt operations. They show up as direct costs on your P&L and indirect losses that affect your profitability over time. And recent data support this. According to McKinsey & Company, inaccurate forecasts cost $1.1 billion in global supply chain waste, including obsolete inventory and excess production.
What’s more, overstocks and stockouts due to inaccurate sales forecasting can cost retailers $1.75 trillion annually. Some more ways inaccurate forecasts cost your restaurant business include-
- Inefficient Labor Allocation: Over-forecasting leads to excess staffing, increasing labor cost as a percentage of revenue. Alternatively, underestimating sales forecasts leads to pressure, impacts productivity, and slows down service. In both cases, you either overspend or miss out on revenue.
- Fluctuating Inventory and Write-Offs: Overestimating demand leads to excess prep and unused inventory, which ties up your cash. On the flip side, under-forecasting results in stockouts, which can force you to purchase inventory at higher rates. That’s capital that could have been otherwise invested in growth.
- Missed Revenue Opportunities: Let’s be real, when demand exceeds expectations, your restaurant will not always be ready to handle it. It may lead to longer wait times, inconsistent service, or unavailable menu items, which affect customer satisfaction. All this, in turn, impacts repeat visits, reviews, and long-term customer value, leading to lost future revenue.
- Ineffective Operational Planning: If your forecasts are frequently inaccurate, teams may stop depending on them. This leads to inefficiencies across scheduling, procurement, and prep. Such a lack of structure increases operational costs and limits growth.
How to Improve the Accuracy of Your Restaurant Sales Forecasting?
If you constantly have to make last-minute decisions because your actual sales did not match expectations, it’s time to look at your restaurant forecasting processes. Here are the key strategies to improve your sales forecasting accuracy-
1. Consider Seasonality
Seasonal changes in forecasts are often reduced to simple comparisons like “this month vs last year.” That approach misses the nuance. Every day at your restaurant can’t be the same. Demand will change across weeks, around holidays, and even across pay cycles, which a lot of forecasts forget to consider.
So, instead of relying on broad seasonal and market trends, break them down-
- Week-by-week patterns within a month
- Pre vs post-holiday customer behavior
- Pay-cycles
- Weekend fluctuations across weeks
Look at how specific days behave within a season. For example, the first weekend of a festive period may see high demand compared to weekdays. It is important to consider seasonal fluctuations as set patterns that you can refine over time.
2. Check the Weather
Weather is one of the most cited factors impacting customer demand and restaurant sales. A new study from Ohio State University suggests that weather not only impacts customer traffic, but also their mood and restaurant experience.
As a result, you must factor in weather shifts in your forecasts and be very specific. A simple “rain reduces footfall” understanding will not always hold. What matters is how the weather affects your restaurant.
For instance, light rain might reduce dine-in traffic but increase delivery orders. Extremely hot days can affect lunch traffic, but dinners will see the usual customer volume. So start tracking how different weather conditions correlate with your sales, by daypart and channel.
3. Use Technology for Accurate Forecasting
Manual restaurant forecasting works up to a point. Beyond that, it becomes inconsistent. This is because different people approach forecasts differently. Their assumptions may be subjective, they may use different formulas, and view demand across different aspects.
This approach brings inconsistency to your forecasts, which creates a mismatch with reality. Here, technology standardizes the process of pulling data, identifying trends, and generating forecasts. And this is where you need the right tech stack to make it happen-
- Integrated POS system to track hourly/weekly/monthly and channel-level trends
- Inventory management systems to incorporate forecasts into menu and ingredient planning
- Labor scheduling tools to align staffing with demand by time slot
Plus, make sure all this data works together to improve your forecasting accuracy. When your POS, inventory management, and labor tools are aligned, you can finalize procurement quantities based on future sales forecasts, use inventory data to identify sales forecasting issues, and match staffing with actual demand.
4. Evaluate AI Forecasting Platforms
AI is useful in forecasting because it can manage complex data that is otherwise tricky to analyze manually. In fact, 36% of operators expect AI to improve their restaurant operations, loyalty programs, and procurement and supply chain management.
AI-driven forecasting systems can look at multiple variables, such as day of the week, time slots, channel mix, and recent trends, together and identify past sales patterns. They can also adjust forecasts continuously as new data comes in, making the process more efficient.
Overall, AI offers a few clear advantages in improving forecasting accuracy:
- Granular forecasting at scale: AI can break demand down by hour, daypart, and channel simultaneously. Instead of one daily number, you get an in-depth view of when and where demand will come from. Thus, helping you improve employee scheduling and food measurements, as it did for a major US-based fast food chain.
- Real-time forecast updates: As new data comes in, forecasts adjust automatically. If demand increases mid-week suddenly, the system reflects that shift without waiting for manual intervention.
- Consistency across locations and teams: Forecasts are generated using the same logic each time, eliminating variation caused by different people or methods.
- Scalability: Where AI becomes useful is scale. As you add more locations, channels, or menu complexity, AI processes all variables without impacting the quality of forecast results.
AI allows you to work with more information, update faster, and maintain consistency, three things that are difficult to achieve manually.
Chili’s also implemented AI models for demand forecasting in their operations, and this is how it improved accuracy by 20%.
5. Analyze Past Sales Data and Identify Patterns
Looking at past sales data is the ideal starting point to ensure reliable and accurate forecasting. And your POS system already stores information that directly impacts forecasting accuracy.
You can use daily and weekly sales trends to see when demand builds, but that’s not enough. You also need to consider daypart customer behavior and menu mix to make it actionable.
For instance, two days with the same total sales can have completely different kitchen and staffing requirements. One day, you may need more kitchen and waitstaff due to high-value dine-in orders. On the other hand, you may see high delivery volume and need more delivery riders.
But if you treat both as identical in your forecast, it will impact your operational decisions. So it’s best to track-
- Hourly sales distribution across days
- Channel-wise contribution (dine-in, delivery, takeaway)
- Menu mix patterns to understand customer preferences and plan inventory
This approach will shift forecasting from “how much will we sell” to “what exactly will we need and when,” and that’s where accuracy will start improving.
6. Incorporate External Factors
Most forecasting issues arise because restaurant operators may ignore what’s happening around the restaurant. Your weekend sales did not drop suddenly because your food wasn’t good, but maybe because a nearby roadblock or construction affected accessibility.
So, it is crucial to consider such external factors to accurately predict future sales-
- Local events such as concerts, sporting events, or art shows can increase customer traffic in the area and boost your restaurant’s sales volume.
- Weather changes that shift demand across channels
- Competitor activity, such as a new restaurant opening, closures, or limited-time promotions
- Seasonal changes that affect customer preferences
- Economic shifts, such as an increase in taxes or a new pricing policy, may have made dining out more expensive for the customer.
Once you have identified key external factors, you need to adjust forecasts based on them. For example, if there is a big local event, your forecast should reflect higher evening demand even if historical data does not show it.

7. Use Rolling Forecasts
Static weekly forecasts don’t work because they assume conditions stay unchanged. Rolling forecasts solve this by keeping your projections in line with what’s actually happening right now.
A practical way to approach this is through a rolling forecast, spanning a few weeks to a few months, where you continuously update projections for sales, labor, and food costs as new data comes in.
Here’s how you do it-
- Replace forecasted numbers with actuals as each week progresses
- Recalculate the upcoming weeks based on the latest trend
- Adjust staffing and inventory requirements accordingly
For instance, if the past two weeks show a steady increase in delivery demand, use this insight to plan the next few weeks. The same applies to food and labor costs, which should align with updated sales expectations.
8. Create a Feedback Loop in Restaurant Operations
Forecast accuracy doesn’t improve just by reviewing numbers and processes. It improves when you take feedback from both what happened and the people who experienced it.
Start with the data. Compare forecasted vs actual performance and break it down to make it useful. Look at where the gap is. Are there any specific days, time slots, or channels showing differences?.
Then ask for operational feedback. Your floor managers, kitchen leads, and shift supervisors are the ones living the reality and can identify more patterns than your forecasting tools can.
They know when and why demand was unusually high, or when a menu item’s performance changed. Such a collaborative approach will help you build forecasts that reflect both actual performance and on-ground reality.
Sudhin Siva, Chief Asset Management Officer at Shamal Holding, talks about his biggest professional learnings and points out that better outcomes often come from collaboration rather than top-down decisions-

Listen to the full conversation with Sudhin Siva on Restrocast for more such interesting, on-ground insights.
Achieving Forecasting Accuracy in Multi-Location vs Single-Unit Restaurants
Forecast accuracy is relatively easier to improve in a single-unit restaurant because you’re dealing with limited and familiar variables. You’re working with one demand pattern, one customer base, and a smaller range of external factors. If there’s a change in demand, you can identify trends early and adjust your forecasts.
On the other hand, multi-location restaurants don’t have this advantage. For these formats, forecasting sales accurately is harder not only because of scale, but also because each location behaves like a different business.
This leads to three major challenges-
- Variation in Demand Drivers: Two outlets under the same brand can follow completely different patterns. A location near offices will see a higher weekday lunch rush, while one in a residential area will thrive on weekends. Applying the same forecasting logic across both immediately reduces accuracy.
- Inconsistent Forecasting Inputs: Similarly, no two outlets will capture or interpret data the same way. Differences in menu availability, pricing, local events, or even operational discipline will impact the quality of historical data, making forecasts less reliable from the start.
- Unreliable Brand-Level Forecast: A brand-level forecast may show you higher demand patterns, but it may not consider location-specific factors. So when you break it down, individual locations can be over- or under-performing significantly.
So, in the case of multi-location restaurant chains, you again need to consider every location as a separate business to create separate forecasts. Sure, you can create a standardized forecasting framework, but the final predictions should be based on location-specific inputs, past data, and external factors.
Measuring Forecast Accuracy: Metrics Restaurants Should Track
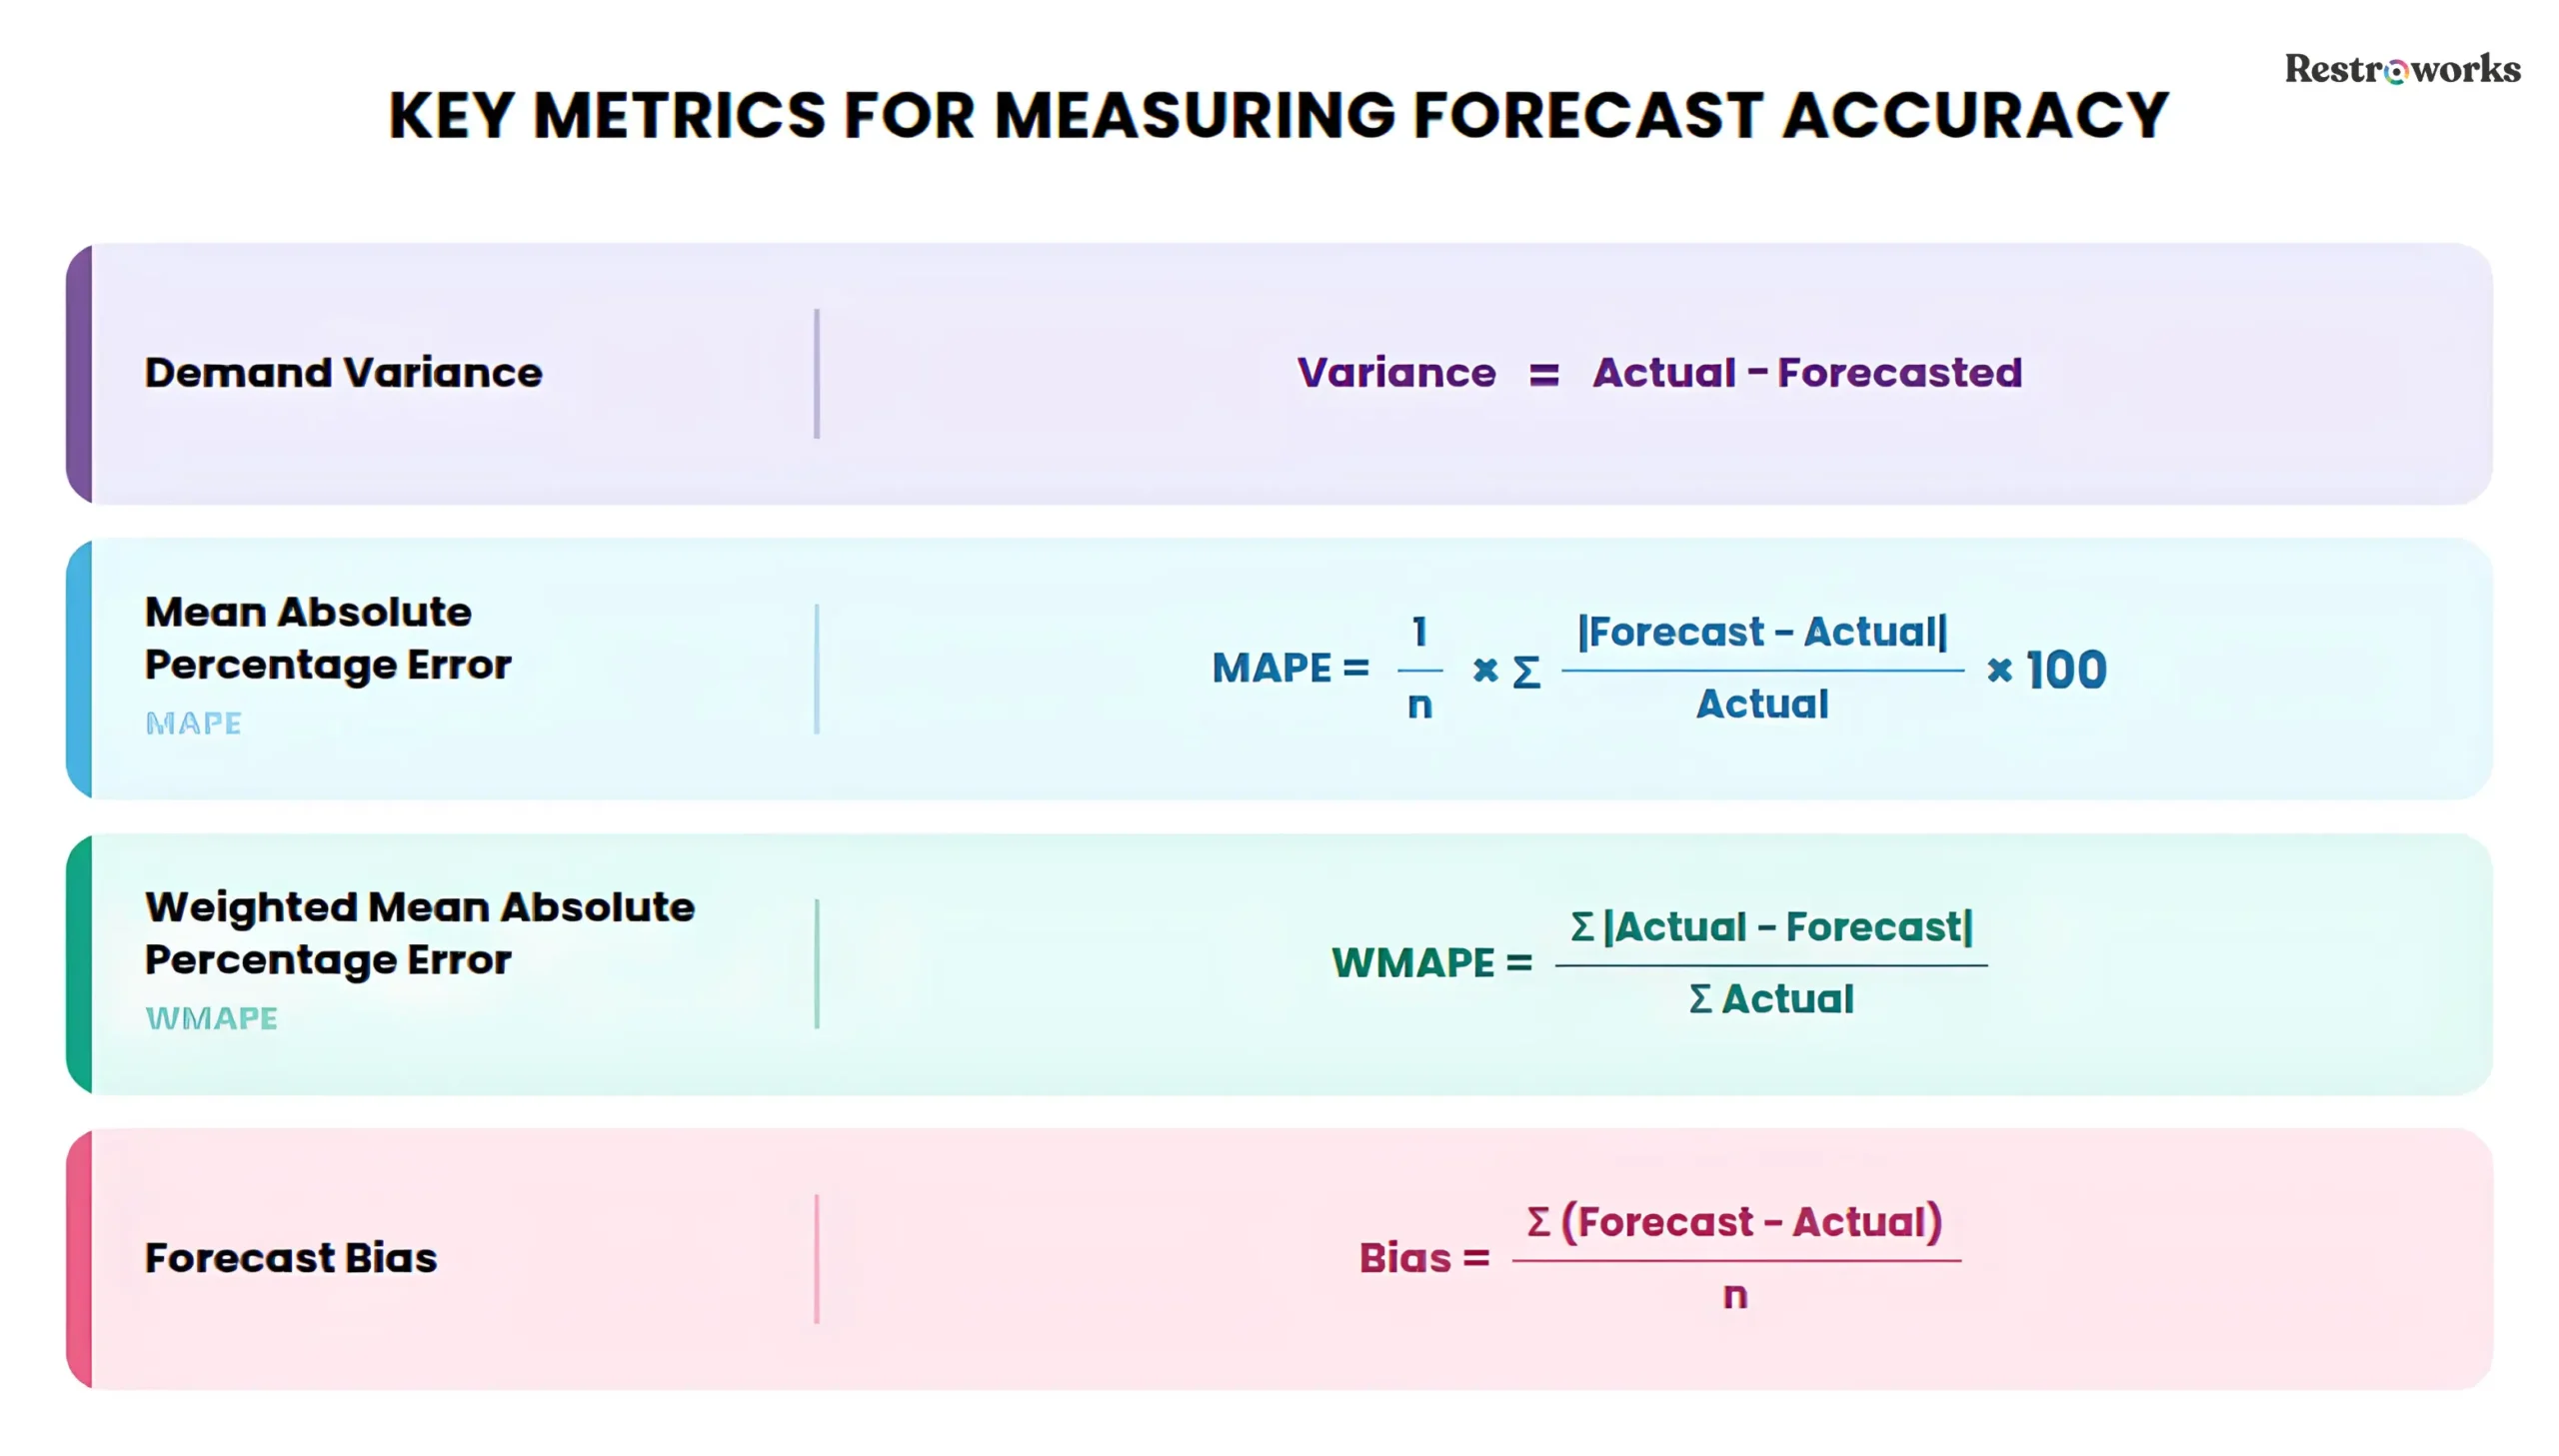
A. Demand Variance
Comparing forecasted vs actual demand is the most direct way to understand how your forecast is performing. You simply need to look at the difference between what you expected and what actually happened for variance reporting. You can calculate variance as-
Variance = Actual Demand – Forecasted Demand, or
Variance % = (Actual – Forecast) / Forecast × 100
For example, if you planned for 200 covers and ended up serving 240, you have a variance of 20%, which can create pressure on the staff and inventory management.
B. Mean Absolute Percentage Error (MAPE)
MAPE gives you a clear view of accuracy by expressing the error as a percentage. It basically expresses forecast errors as a percentage of actual demand.
MAPE = (1/n) × Σ (|Forecast – Actual| / Actual) × 100, where n is the number of periods.
Say you expected 150 guests during dinner service but ended up getting only 130 covers at the restaurant.
MAPE would be = |(150-130)/110| x 100 = 18.1%
Because it’s a percentage, it’s useful for benchmarking across service periods or channels. In practical terms, a lower MAPE indicates better forecast accuracy.
C. Weighted Mean Absolute Percentage Error (WMAPE)
MAPE treats all errors equally, without considering the strategic importance or value for the restaurant. But this is what WMAPE fixes, by giving more weight to what matters. WAPE gives you a more realistic view of accuracy by weighting errors based on actual demand.
For instance, underestimating demand on a weekend will carry more influence on operations than on other days. To calculate the weighted mean absolute percentage, use the formula-
WMAPE= ∑ |Actual – Forecast|/ ∑ Actual
D. Forecast Bias (Mean Forecast Error)
While the previous metrics focus on the size of the error, bias tells you the direction of that error. It shows if you are consistently over-forecasting or under-forecasting for sales. Through this insight, it helps you course-correct better.
- If you’re constantly overforecasting, you’ll end up with excess stock, staff, and waste, which will tie up your working capital.
- If you’re underestimating your sales, you’ll be dealing with stockouts, low staff availability, and missed revenue.
Forecast Bias = Σ (Forecast – Actual)/n
A positive result means you are underforecasting, while a negative one means you’re overforecasting sales.
Forecasting restaurant sales precisely helps you streamline operations and optimize costs, for both inventory and staffing. That is why improving accuracy is essential to achieve better outcomes.
This starts with looking at the right data, updating forecasts as things change, and using the right metrics to track success. As you track historical data, use predictive analytics, and implement AI and technology, you can make informed decisions and enhance overall customer experience at your restaurant.