
For a restaurant using a POS system, you’re probably already sitting on a lot of data. These advanced systems track daily sales, item reports, hourly sales trends, customer preferences, inventory usage, and so much more. It’s all right there.
But when it comes to actually using the data for sales and demand forecasting, you’re not sure where to begin. You’re not alone. Research suggests that around 95% businesses are struggling with using unstructured data.
So you end up wondering, which numbers matter? What should you be looking at? And how do you go from looking at a report to interpreting it in a way to actually use for planning inventory or staffing? This blog will answer these questions and explore how leveraging POS data for restaurant forecasting benefits your restaurant business.
What you will learn
- Why POS data is useful for forecasting restaurant sales and demand
- Different metrics that restaurants can track for forecasting
- How to use the data to conduct complex forecasts
Understanding POS Data for Restaurant Operations and Forecasting
The USA Restaurant POS market is valued at $30 billion as of 2024, driven by digital payment adoption and technology integration. But that’s not all the system is useful for.
At the most basic level, your POS system in restaurants records what was sold and when. But for forecasting, that’s only the starting point. A POS featuring restaurant forecasting tool goes even deeper to help you plan ahead by turning item-level sales, order timing, modifiers, and channel splits into reliable demand predictions.The system automates all this and helps you identify patterns that you otherwise have missed.
It’s a goldmine of critical business information that you can use to not just forecast demand, but improve space planning, optimize menu offerings, control costs, and streamline operations for profitability.
Why Should You Use POS Data for Forecasting?
- To Streamline Inventory Management: POS data captures inventory movement in real-time, so you don’t need to rely on rough estimates. It supports data-driven decisions based on actual consumption patterns. You can identify which items sell consistently and which have a high demand on certain days or hours. This reduces last-minute stockouts as well as over-ordering that leads to food waste.
- To Enhance Operational Efficiency: Forecasting with POS data allows you to align prep, kitchen workflows, and staff schedules with real demand patterns. You can anticipate when demand is going to rise and prepare accordingly. The result is smoother service, better coordination, and less pressure on your staff during peak traffic.
- To Plan Menu: POS systems give you a clearer picture of your best-selling menu items. It tells you which items will be in high demand and which may not. Armed with these insights, you can make more grounded and profitable menu decisions.
- To Improve Customer Experiences: Better demand forecasting directly impacts what your customers experience. When popular items are always available, and service runs smoothly during busy periods because you accurately predicted something, it reflects in better customer satisfaction. POS data helps you maintain that consistency by ensuring you’re prepared for what’s coming.
Talking about being the first to introduce an enterprise point of sale system in the US while at Legal Sea Foods, Chris Incorvati, now the Chief Technology Officer at Jack’s Family Restaurants, says-
Watch the full conversation here-
Types of POS Data to Track and Use for Restaurant Sales Forecasts
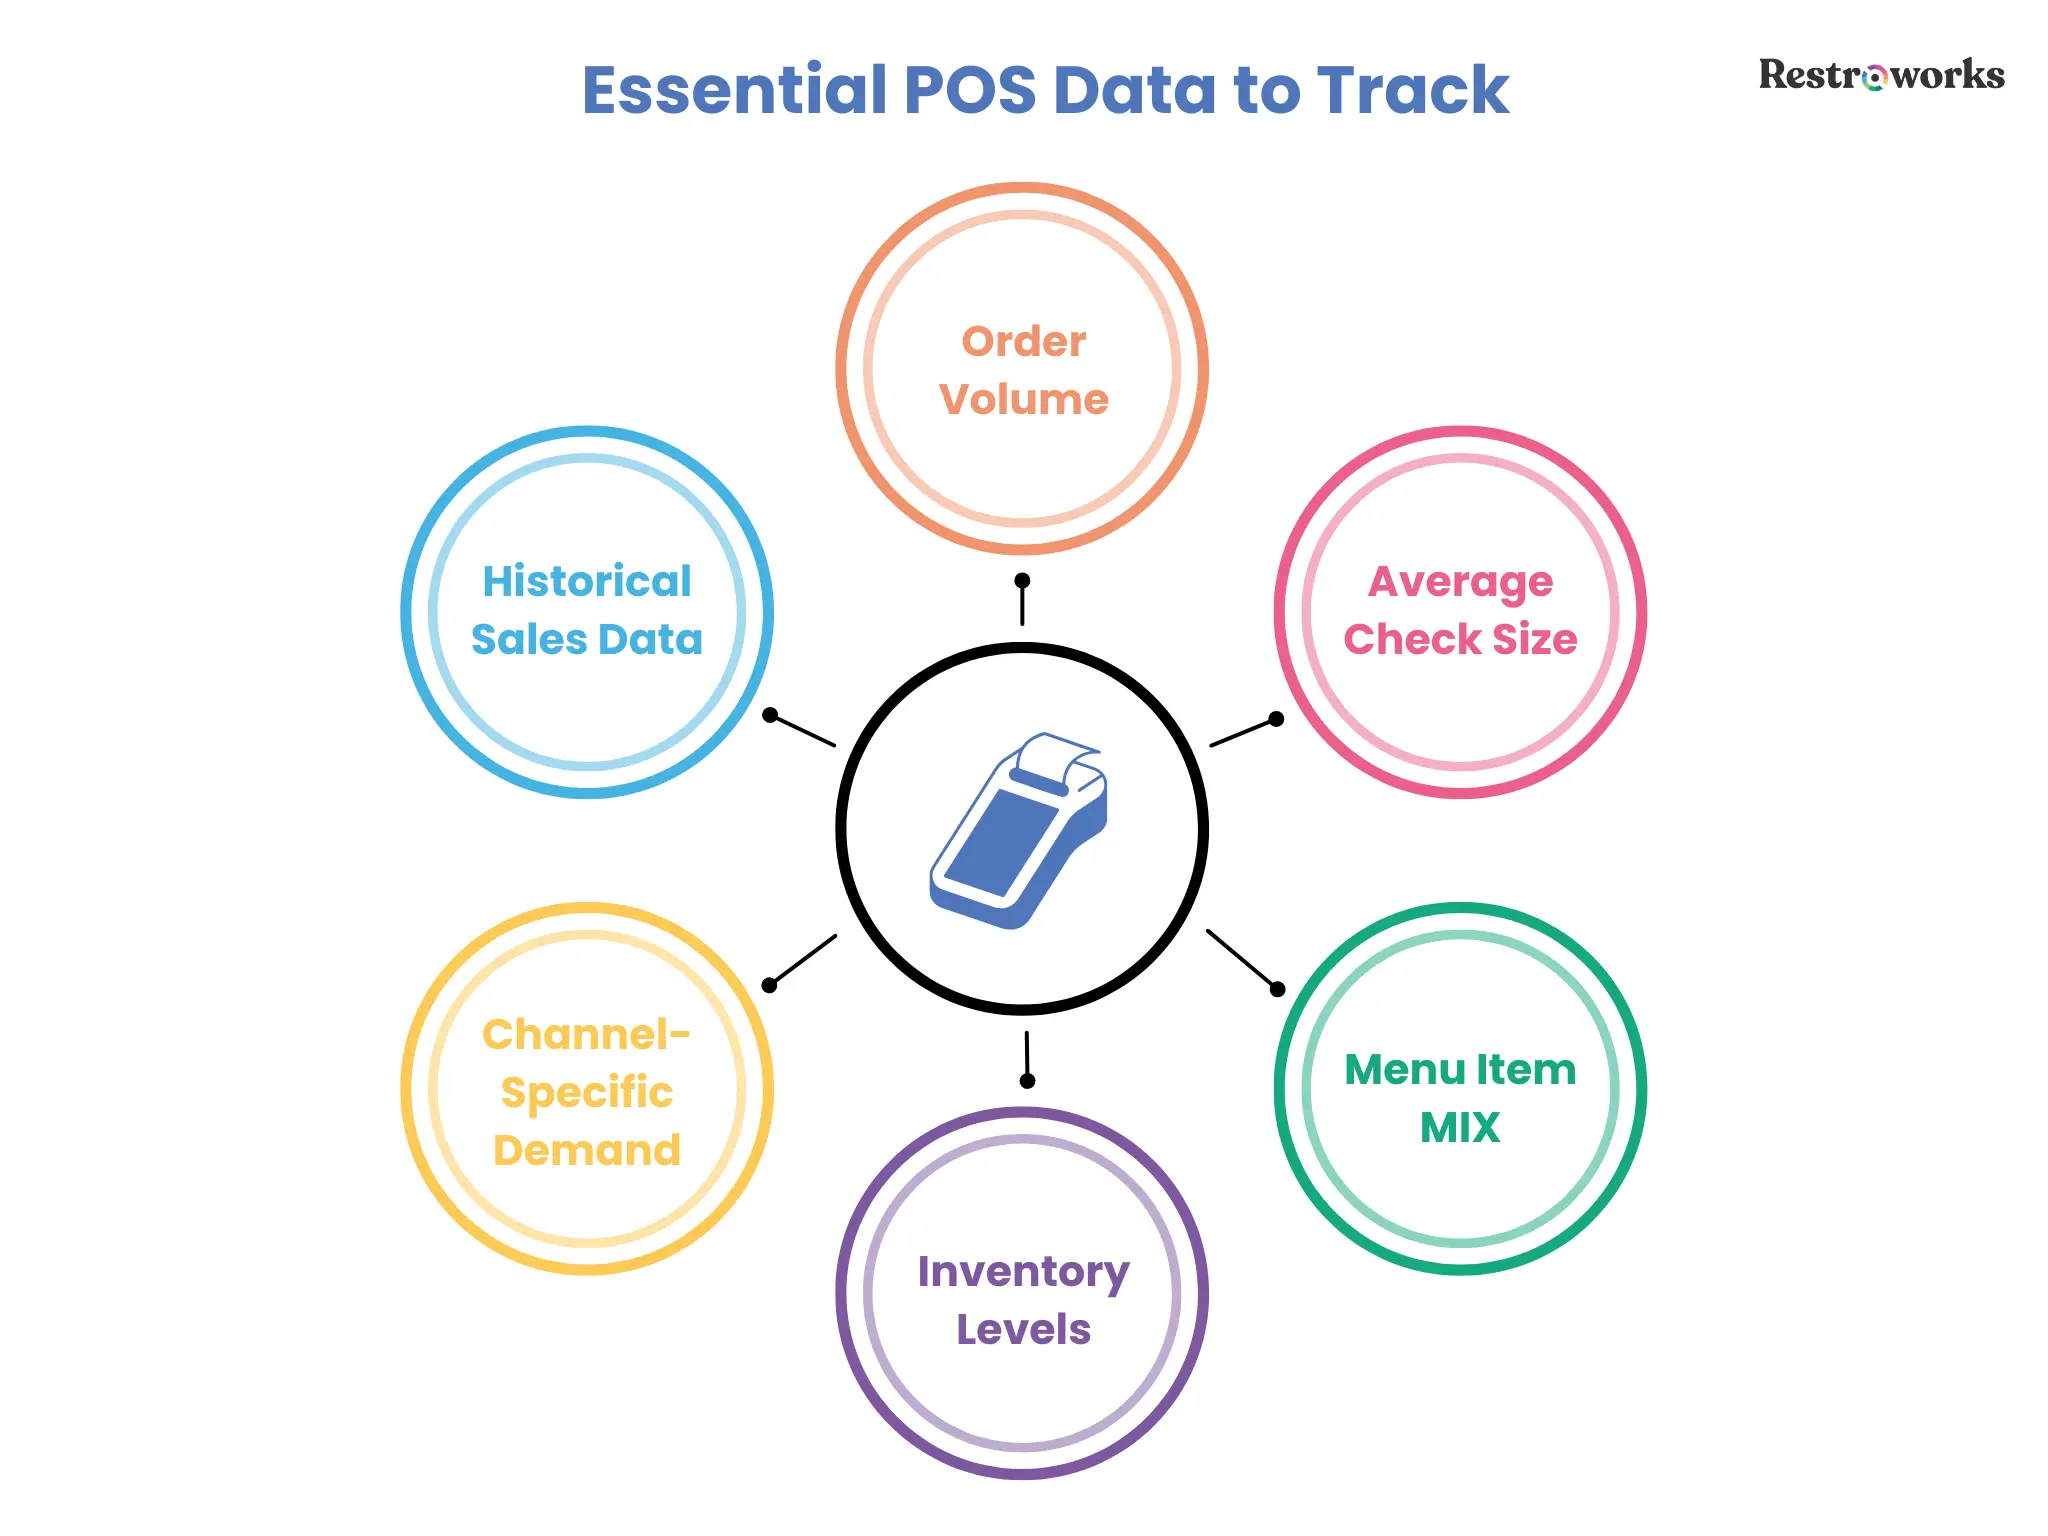
Restaurant POS systems generate and capture various types of data to help restaurant owners understand demand, revenue, and operational planning. Here are the key data types you can use for sales forecasting purposes-
A. Historical Sales Data
POS systems track every transaction with item details, prices, guest cover, guest details, and timestamps. Along with it, you can get an overview of the total sales and a granular view of-
- Daily/hourly/weekly/monthly sales trends
- Number of transactions in a given period
- Average transaction value
- Item-wise sales trends
- Service-wise sales
Using sales summary reports, you can identify peak sales periods, best-selling items, changing future trends, and assess overall sales performance to make more informed decisions.
B. Order Volume
Revenue can fluctuate due to pricing, but order volume tells you the number of orders your kitchen handled. This is a more reliable indicator of demand. Because you might see two days with very similar revenue, but the source could be different.
One could be driven by a few high-value orders, while the other day saw high customer traffic with smaller check sizes. Plus, this order volume could also vary across different channels, with some days seeing more delivery orders than dine-ins.
That’s why tracking guest count for dine-in or order count for delivery is a good way to understand demand.
C. Average Check Size
Average check size, calculated by dividing total sales by the number of covers, helps you understand how much each order contributes to revenue.
If your average check size increases, revenue may increase without a corresponding rise in order volume. So, tracking this alongside order volume is the best way to avoid overestimating demand based on revenue alone.
D. Menu Item Mix and Customer Preferences
Forecasting restaurant demand as a whole is one thing, but wouldn’t it be good to know what it will look like for your menu? The menu item mix data from your POS system tells you exactly that.
It focuses on the distribution of demand across specific menu items. You can identify which items are likely to sell more during a specific period based on historical data, and plan your inventory and kitchen prep accordingly.
Plus, you can also predict item-level demand based on weather changes or seasonal sales trends, such as an increase in cold beverages during the summer. If you want to understand how POS systems can track seasonal trends, Behind the Apron podcast breaks it down for you.
E. Repeat Orders
Repeat orders give you a sense of the stability of your demand. If a large share of your business comes from returning customers, it’s one predictable factor that you can rely on for planning future sales.
G. Stock Levels
Inventory data monitors stock levels, usage, wastage, and purchasing in real-time to give you an accurate view of inventory levels. Here, you can connect these insights with the sales and menu mix data to identify which ingredients are used more quickly and which hold your working capital.
This lets you prevent under- and overstocking, minimize waste, and control costs better.
H. Channel-Specific Demand
Demand doesn’t behave the same across dine-in, takeaway, and delivery, and your point of sale system captures this division clearly. An advanced POS system will allow you to track sales, peak times, order patterns, and item preferences, and more across all three, making it easier to predict demand.
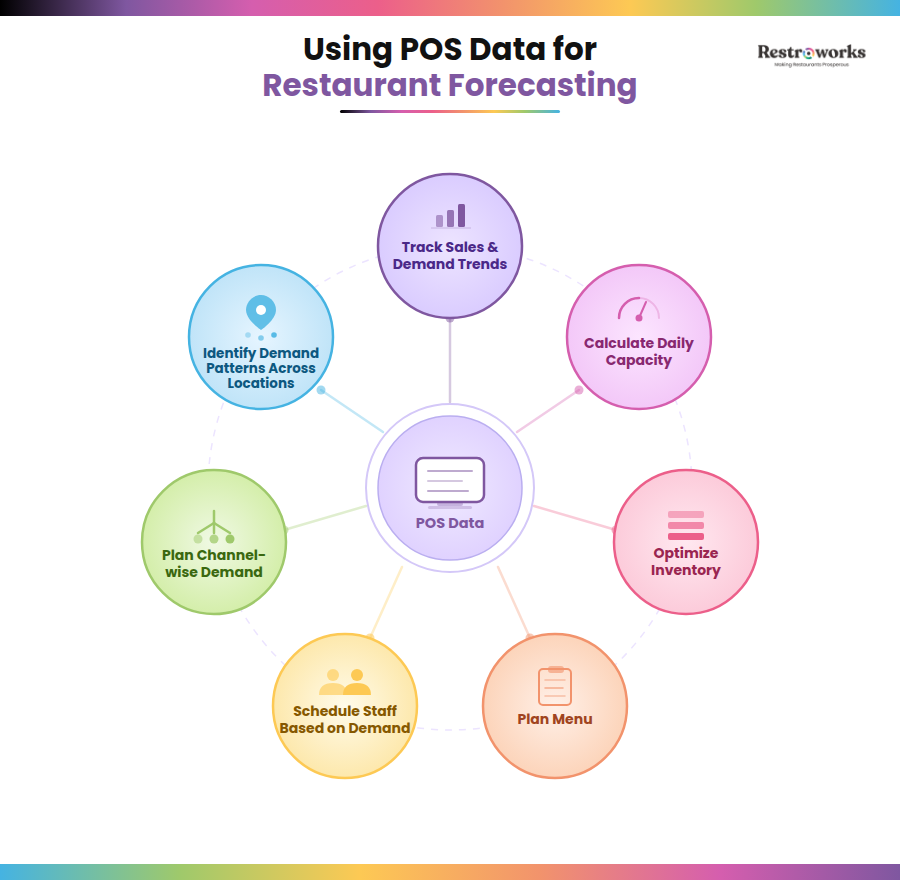
How to Leverage POS Data for Restaurant Forecasting?
Today, only 18% of restaurant operators admit to having high confidence in their ability to accurately forecast demand and control costs.
That’s why you need your point of sale system to make demand forecasts more reliable, accurate, and actionable. Here are the ways in which you can use this data-
1. Track Restaurant Sales and Demand Trends
Let’s start with the basics. Go back to your POS system and pull basic sales data for the last few weeks or months and compare like-for-like periods.
This is because a weekday behaves very differently from a weekend. Even on weekdays, demand will never be linear. Once you start looking at similar days together, you start noticing patterns. For instance, maybe dinner service on Wednesdays is consistently full, while Monday has the lowest demand.
Also, don’t rely on revenue alone here. Look at how many orders came in, what categories were in demand, and which services had the highest transactions. This helps you get a sense of “what normal looks like” before you move on to predicting demand.
2. Calculate the Restaurant’s Daily Capacity
Calculating your restaurant’s daily capacity is an important tool for establishing a baseline for your restaurant sales forecast. So, instead of estimating your sales from scratch, you are essentially using your busiest days as reference points.
This involves looking at total orders for the day, table turnover, and average check size. From there, you can estimate your working capacity.
For instance, say your restaurant has 20 tables. During a dinner service on a Friday, all 20 tables are full, and you achieve a table turnover of 2 rounds for each table. Now this means your daily capacity is 20 tables x 4 guests x 2 turns = 160.
You also know that your average check size on a busy service is $30. Based on this data, you can forecast serving 150-160 on the upcoming Friday and bringing in a revenue of $4,800. This is the higher range of your restaurant’s daily capacity that is helping you forecast demand from the POS data.
3. Optimize Inventory
Inventory management becomes a lot easier when you’re not using estimates and spreadsheets to track inventory purchase and usage. Point-of-sale systems can map item-level sales to their ingredients and tell you the exact quantities used or wasted with inventory optimization reports.
For instance, if your POS tells you you sold 120 burgers last Thursday evening, it will break it down into how many buns, patties, and sauces were actually used. Plus, you can also-
- Check which items saw high demand on which days or hours
- Look at how quickly specific ingredients were used
- Identify reorder points
This tells you two important things: what needs to be stocked consistently, and the inventory levels you need to adjust based on the expected demand. So instead of ordering the same quantities every cycle based on historical data, you can start adjusting based on actual movement.
This is a good way to streamline purchasing and control costs. A good example of this is Jimmy John’s Franchise, which was able to reduce bread waste by 53% across 17 locations with AI demand forecasting using inventory data.
4. Menu Engineering
When you break down sales to the item level, you’ll see the variation in demand. Your POS system will tell you which items sell the most and bring the majority of revenue. Or that some menu items are in demand only at certain times of the day. Equipped with these insights, you can-
- Plan inventory accurately for high-selling items
- Redesign your menu to include more items from a popular category
- Promote specials or combos to bring in more customers for your best-selling items
For instance, if you see a high demand for salads or healthy dishes on your menu, you can introduce more variety to boost options. Or maybe you are selling a lot of iced tea during lunch service on hot days, you can use this knowledge to create combos or launch special flavors to influence customer behavior.
5. Schedule Staff Based on Demand
Your POS shows you exactly when things get busy and when they don’t. Looking at key metrics like hourly sales or day part sales will help you identify which periods have historically brought in the most traffic.
So, if you have a coffee shop or bakery with high customer traffic in the mornings, you can schedule more staff to maintain service quality. Alternatively, if you see that weather changes will impact dine-in demand for the next two days, you can quickly manage schedules to have more delivery riders available and limit the front-of-house staff.
Since inefficient staff planning can lead to high labor costs and burnout in employees, leverage POS data to best optimize employee shifts based on actual demand.
6. Plan for Channel-Wise Demand
If you combine basic sales data from dine-in, takeaway, and delivery, you will miss what’s actually happening. This is because demand for all these channels behaves differently; you may receive more delivery orders during lunch but see a full house for dinner service. Even the kind of items ordered can vary.
So, it is a better idea to treat each channel as its own demand stream. This means-
- Establishing sales baselines for each channel to understand demand
- Going deep into hourly sales for each channel to allocate your resources accordingly
- Understanding the item-level differences by channel to adjust your kitchen prep in line with the demand
For instance, if your demand forecasts predict 200 orders for Thursday, use granular data from POS to figure out when those orders are likely to come in and through which channel.
7. Identify Patterns Across Locations
Similar to multiple channels, if you have multiple outlets, consider them separate entities and fetch outlet-wise data from your point of sale system. Track key metrics like order volume by day for each outlet, hourly demand within each location, and item-level data to understand customer traffic and menu demand for each.
Since you’ll be planning for the future based on how each location actually performs, it will result in accurate restaurant sales forecasts.
Managing Complex Forecasting Processes Using Advanced POS Systems
Modern POS systems increasingly integrate analytics, machine learning, and AI-driven insights to give you more dependable data and quality forecasts. Here’s what some of the advanced systems can do-
1. Integrate External Data for More Accurate Forecasting
So far, demand forecasting, as discussed, uses data already recorded in your POS. But demand isn’t just the number of transactions or order volume. There are always external factors at play that you might miss on your own.
This is where advanced systems integrate external inputs like weather, local events, holidays, promotions, and or even competitor activity to improve the quality and accuracy of your forecasts. They can handle this by.
- Isolating these periods instead of mixing them with regular data
- Allowing you to apply manual overrides or scenario-based adjustments
- Tracking how similar events performed or affected demand in the past
For example, if your POS data shows high demand patterns on evenings when there’s an event in your area, you can adjust your forecast to reflect that trend. When these signals are combined with your POS data, your menu forecast will reflect real-world conditions, making it highly reliable.
2. Applying AI Forecasting Models and Algorithms
Advanced POS systems go beyond recording transactions and sales to apply AI and ML capabilities for accurate forecasting. In fact, studies suggest that businesses using model retaining and evaluation see a 20%-30% increase in forecasting accuracy.
Instead of relying on fixed comparisons, these systems process large volumes of POS data up to 100 times faster than other methods, across items, hours, channels, and locations at once. They pick up patterns that aren’t obvious when you’re looking at reports manually, and they adjust forecasts as new data comes in.
For instance, they can apply various Machine Learning models, such as-
- Moving averages: This looks at demand over a set period (say, the last 7 or 14 days) and gives an average. It helps you ignore sudden fluctuations and focus on the overall direction demand is moving in.
- Exponential smoothing: This method puts more weight on recent data. So if demand has started to change in the last few days, your forecast adjusts accordingly rather than tracking older patterns.
- Regression analysis: This model examines how factors such as time of day, day of the week, or external inputs affect demand. It uses those relationships to predict what demand might look like under similar conditions.
These systems equip you with the most reliable information, so you can optimize your restaurant operations and cut costs across food and labor.
Goop Kitchen is a good example of a brand that achieved cost reduction through AI-driven demand forecasting. It optimized its back-of-house operations and enabled precise forecasting, resulting in reduced food costs and a 2% increase in profit margins.
3. Automating Forecasting and Continuous Adjustments
As your data grows, manually updating forecasts becomes difficult to maintain. There are too many moving parts, including menu items, hours, channels, and locations, to keep adjusting everything consistently.
Advanced POS systems handle this by automating the process. As new data comes in, they adjust the forecasts automatically. More importantly, they track how accurate previous forecasts were and adjust accordingly. If your system consistently overestimates or underestimates demand, it corrects itself over time.
This reduces the need for constant manual intervention and ensures your forecasts stay aligned with the on-ground reality.
Common Forecating Mistakes and How to Avoid Them?

- Using wrong or incomplete data: If your POS data isn’t up-to-date, your forecast won’t be either. Small issues like wrong item mapping or missing entries will affect the accuracy of predictions. So, make sure to maintain data accuracy before applying it.
- Focusing on outliers: A particularly busy day, maybe due to a bulk order or local event, can make it seem like demand has increased when it hasn’t. As a result, it is best to avoid such one-off instances when setting a baseline for your demand forecast.
- Comparing the wrong time periods: Comparing weekdays with weekends or regular days with holidays will lead to misleading forecasts. So, always compare like-for-like periods when analyzing sales trends.
- Assuming patterns too quickly: Sometimes things can happen by chance, and it’s tempting to act on that. But that may not always mean one thing was causing the other. It’s always better to check if the pattern repeats over time before you act on it.
Forecasting gets easier once you understand how to fully utilize raw data and interpret it for your goals. The information is already there; you just need to look at the right signals and connect them to actual decisions.
When you break down demand properly and account for differences across items, channels, and time periods in your POS system, your forecasts become more reliable. This empowers you to make more data-driven decisions and drive sustainable growth for the restaurant business.