
Forecasting for Multiple Restaurant Locations: Strategies for Accurate Demand Planning

Forecasting for Multiple Restaurant Locations: Strategies for Accurate Demand Planning

Home / Blog /  

Forecasting for Multiple Restaurant Locations: Strategies for Accurate Demand Planning

Read summarized version with

Well, this particular statistic might come off as shocking to you as it did to me, but hear me out – any average restaurant globally loses up to 4-10% of whatever they earn to food waste and as much as 10-25% to poor staffing, that too EVERY single year. 

That said, I can’t help but revisit this one line, Sam Smith, who is currently working as the Marketing Director at LeanPath, wrote in one of his blogs: “If a restaurant with a $1 million annual food budget loses $40,000 to $100,000 before the food leaves the kitchen, that’s a huge inefficiency.” 

Agree, absolutely, and because we’re right now addressing forecasting for multiple restaurants, that number sounds even more terrifying. Seriously, you’re telling me that if I run 20 locations at once, I could lose 20 x $100,000 every year just like that? 

That’s probably the very reason restaurant forecasting matters even more today.

To put it simply, it is a technique that lets restaurant operators predict future business demand by analyzing past sales, customer behavior, and market trends. Done right, accurate forecasting helps restaurant owners make informed decisions about staffing, inventory management, marketing, and menu planning. 

Now, the bigger question: how do you do it right in the first place?

Hence, this guide. It will walk you through what multi-unit restaurant forecasting looks like, where it usually goes wrong, and how to get around it. 

What You’ll Learn

  • How can you forecast sales accurately across multiple restaurant locations?
  • How can you choose the “right” forecasting software that really aligns with your chain size and needs?
  • How to fix common forecasting mistakes and improve forecast accuracy over time?

What Exactly Goes Wrong When Multi-Unit Restaurants Follow Single-Store Logic?

Surprisingly enough, for the vast majority of us, when we run one restaurant, our intuition is actually a legitimate data source. We know our Tuesday lunch crowd, and how Friday is going to be slower before the long weekend rush. 

But the moment we open a second or third location, that same intuition doesn’t cut it anymore. 

Why? Because every restaurant location is shaped by a completely different set of demand patterns. Your downtown location, for example, might be drawing office workers Monday to Friday, while your suburban spot sees its biggest volume on Saturday brunch.

Now, it’s quite common sense that you can’t employ the exact same business strategies at both outlets and expect “good” results. After all, accurate restaurant forecasting requires location-level demand forecasting and granularity.

Trade Area Behavior

The demand profile of each restaurant location depends on a few factors, like who lives, works, and moves through its trade area, when they visit, how often they order, what specifically they spend mostly on, seasonal fluctuations, whether they prefer delivery or dine-in more, etc., etc. For the record:

Trade Area TypeDemand CharacteristicsWhat This Means for Forecasting
Office/CBDMost of the weekly volume comes between Tue-Thurs, sharp Friday drop, near-zero weekends.Daypart forecasts work better here.
Residential/SuburbanWeekend-heavy, predictable weekly rush, school-calendar driven.Seasonal fluctuations tied to school breaks; lower day-to-day volatility.
Tourist/DestinationExtreme seasonality, detached from local residential patterns.The annual forecast model needs separate peak/shoulder/off-season parameters.

Urban vs. Suburban Demand Volatility

Urban restaurant locations are much more complex and unpredictable. There are more external factors competing for customer attention and more variables that can swing demand on short notice. Local events, weather changes, market trends, and customer traffic patterns all influence forecast accuracy differently across sites.

Suburban locations, on the other hand, are more predictable week-to-week but show sharper seasonal fluctuations.

Neither is “easier” to forecast. They just require different models. And that is the core problem with most multi-location restaurant forecasting. Restaurant operators build one model and apply it everywhere, then wonder why their sales forecast is always off at at least half their sites.

What are the Core Principles of Restaurant Forecasting? 
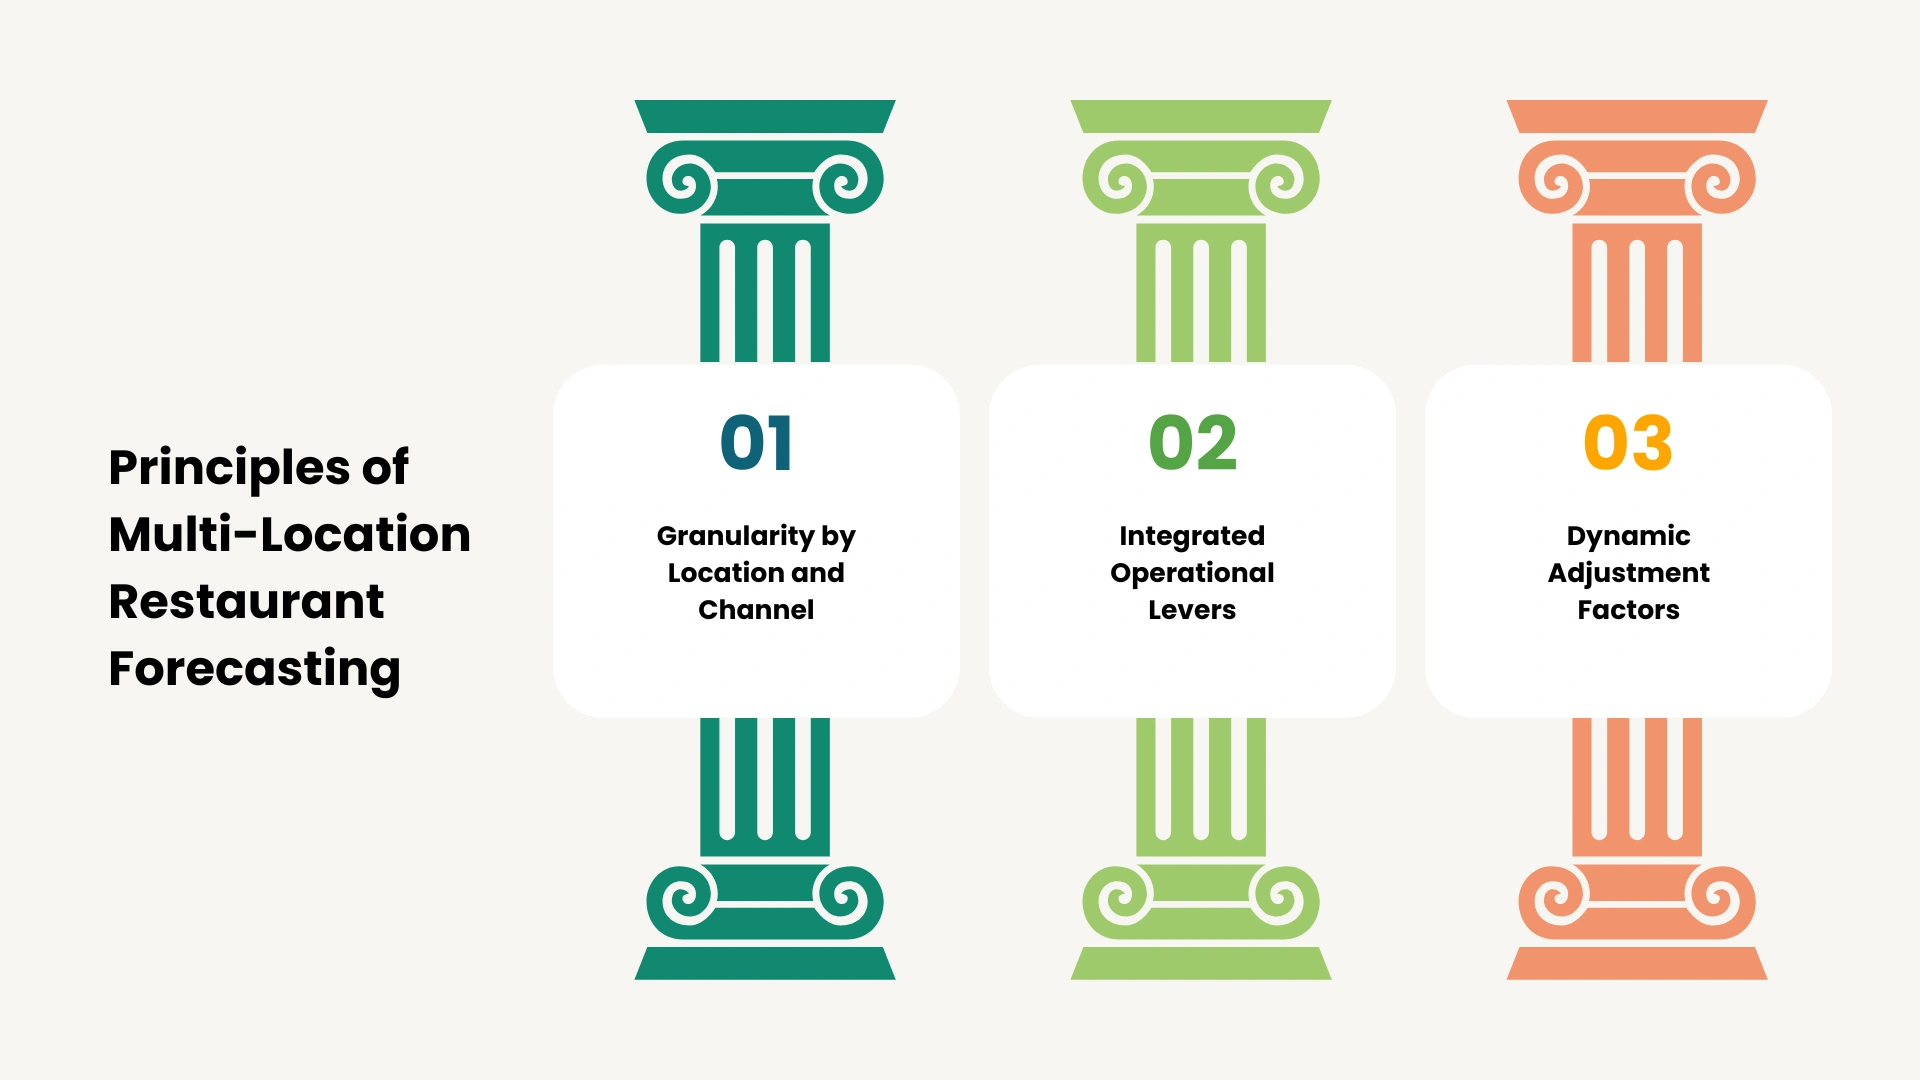
What are the Core Principles of Restaurant Forecasting for Multiple Restaurant Locations?

There are three key layers that make multi-location restaurant forecasting actually work. These are: 

Layer 1: Granularity by Location and Channel

Accurate restaurant forecasting at scale starts with granularity at the store-level, channel-level, and daypart-level. 

At the store level, each location needs its own demand forecasting model that accounts for its specific customer demand, nearby competitors, customer preferences, and the local events that drive or suppress volume. That means a concert venue two blocks from your downtown location will influence how many covers you get on Friday night. Your suburban location, eight miles away? No impact at all.

💡Now here’s something interesting – Chipotle Mexican Grill has built an entire system around AI-powered predictive analytics and restaurant forecasting. What it does is automatically pull in variables like weather, local events, historical sales, and operational data at the location level. Result? Their forecasting runtime dropped from nearly 24 hours to just minutes, and prediction variance reduced by about 50%.

It means their inventory now aligns much more closely with actual demand, staffing matches real traffic patterns, and decisions that earlier ran on lagging data now adjust almost in real time. This is exactly how predictive analytics is supposed to transform restaurant forecasting from reactive planning to data-driven operational efficiency.

Next comes the channel-level forecast. Ask yourself: On a particular rainy day, what does dine-in and delivery look like at your outlets? Will they be the same? Of course not. You already know dine-in will dip and delivery will spike (or vice versa, as per the season concerned). 

Catering is an entirely separate demand stream with its own lead time for food costs and labor scheduling as well. You can’t lump it into a single daily restaurant sales.

Channel Primary Demand Driver Weather Sensitivity Forecasting Tips
Dine-in Foot traffic, occasional dining High According to the NRA, 90% of restaurants report reduced sales due to weather changes. Use the local event calendar to identify traffic spikes.
Takeout Convenience, speed Moderate Monitor lunch daypart demand closely at office-heavy locations.
Delivery Weather, late-night, convenience-led occasions Very High 49% of consumers are more likely to order delivery during bad weather conditions. Integrate a weather API directly into the forecasting model.
Catering Events, corporate calendars Low Forecast separately since catering demand follows longer planning cycles.

Then, we have daypart forecasts. Breakfast, lunch, dinner, and late-night each have their own demand drivers and cost structures. If your sales forecast only gives you a daily total, your morning prep team has no real guidance on what to expect, and your dinner crew is working off averages that may have nothing to do with tonight specifically.

Layer 2: Integrating Restaurant Operations, Menu Planning, Food and Labor Costs

A forecast that stops at projected revenue is half a tool. The real value of accurate forecasting is what it unlocks downstream. For example:

Operational Lever How the Forecast Drives It Without It?
Labor Planning Your daypart forecast tells the scheduler exactly how many covers to staff for. Managers schedule by habit.
Inventory Management Item-level sales forecast drives prep list and ordering quantities. You are either over-ordering and writing off spoilage, or running out and losing sales. (Or Both actually!)
Food Cost Control Recipe-level yield translates your forecasted covers into ingredient weight. Food costs run 3–8 pts above target with no visibility into why.
Cash Flow Weekly revenue forecast feeds purchasing budget and payroll planning in real time. You are making purchasing and payroll decisions without knowing what the week is actually going to be like.

In all, forecasting sales helps restaurant owners reduce waste, control labor costs, and improve customer satisfaction by aligning inventory management, staffing, and menu planning with demand. Effective forecasting also touches every corner of restaurant operations, including estimating the number of guests and determining the quantity of ingredients needed.

Using proven forecasting formulas and industry benchmarks, successful restaurant leaders can transform raw numbers into clear financial plans. Effective forecasting supports cash flow management, helps with budgeting and turnaround plans, and keeps teams accountable to realistic targets.

Layer 3: Dynamic Adjustment Factors

Static historical sales data tells you what happened. Dynamic adjustment factors tell you what’s different this time. Indeed, both are non-negotiable. 

So what should you actually account for?

Seasonality and holidays are the obvious starting point, but the timing of holidays matters as much as the holiday itself. 

Think about it: do you get the same covers on a Wednesday Thanksgiving vs a Thursday Thanksgiving? Of course not. 

Similarly, local events have a much outsized effect. For example, you can consider location-level forecasts like a marathon route that runs past your downtown location, a high school graduation weekend, or a regional festival that draws visitors from three counties over.

And then there’s weather. Everyone knows rain impacts dine-in and boosts delivery. But very few actually quantify that relationship and build it into their predictive analytics model. Same with temperature. It affects customer behavior, average spend, projected sales, and purchasing patterns.

This way, forecasting helps restaurants plan for future sales per season and events, allowing them to adjust staffing and inventory management accordingly.

Must-Know:

Promotions and menu changes are another dynamic factor one must keep tabs on. When you run a limited-time offer or swap a high-velocity item, your historical data for that period loses predictive value. And thus, your forecast needs to account for that shift explicitly, not just average it out.

Where Does Historical Data Analysis & Forecast Accuracy Fall Short & How Do You Fix It?

Here’s something that you MUST know: historical data analysis is necessary, yes, but it is not sufficient on its own. 

That means – while historical data tells you what customers expect or did, it often does so under conditions that may no longer apply. 

A new competitor, for example, that opened three months ago is not in your historical baseline, but it is absolutely in your current demand reality. Same with a neighborhood demographic shift, a road construction project, or even a menu change. 

All of these create gaps between past sales and future demand.

And that’s exactly what you need to fix.

The Problem Where It Fails The Fix
Historical data is a lagging indicator New competitors, road changes, and demographic shifts Combine historical data analysis with active market research and manager input
Anomalies corrupt the baseline A one-off event or supply chain disruption creates a false pattern that misleads future forecasts. Flag and exclude anomalies; build an event log for every location
Static annual forecasts A plan built in January is useless by April if conditions shift Use rolling forecasts updated every 4 weeks from the most recent 12-16 weeks of actual sales.

Mind that forecasting in the restaurant industry involves systematic analysis of past and present data to make accurate predictions about future trends and events. Historical data analysis is a common method used in restaurant forecasting to predict future demand based on past sales and customer preferences.

Thus, leveraging historical data is crucial for building accurate forecasts in restaurants, as it helps identify seasonal trends and informs future operational planning.

What Does the Restaurant Operations for Multi-Location Forecasting Look Like?
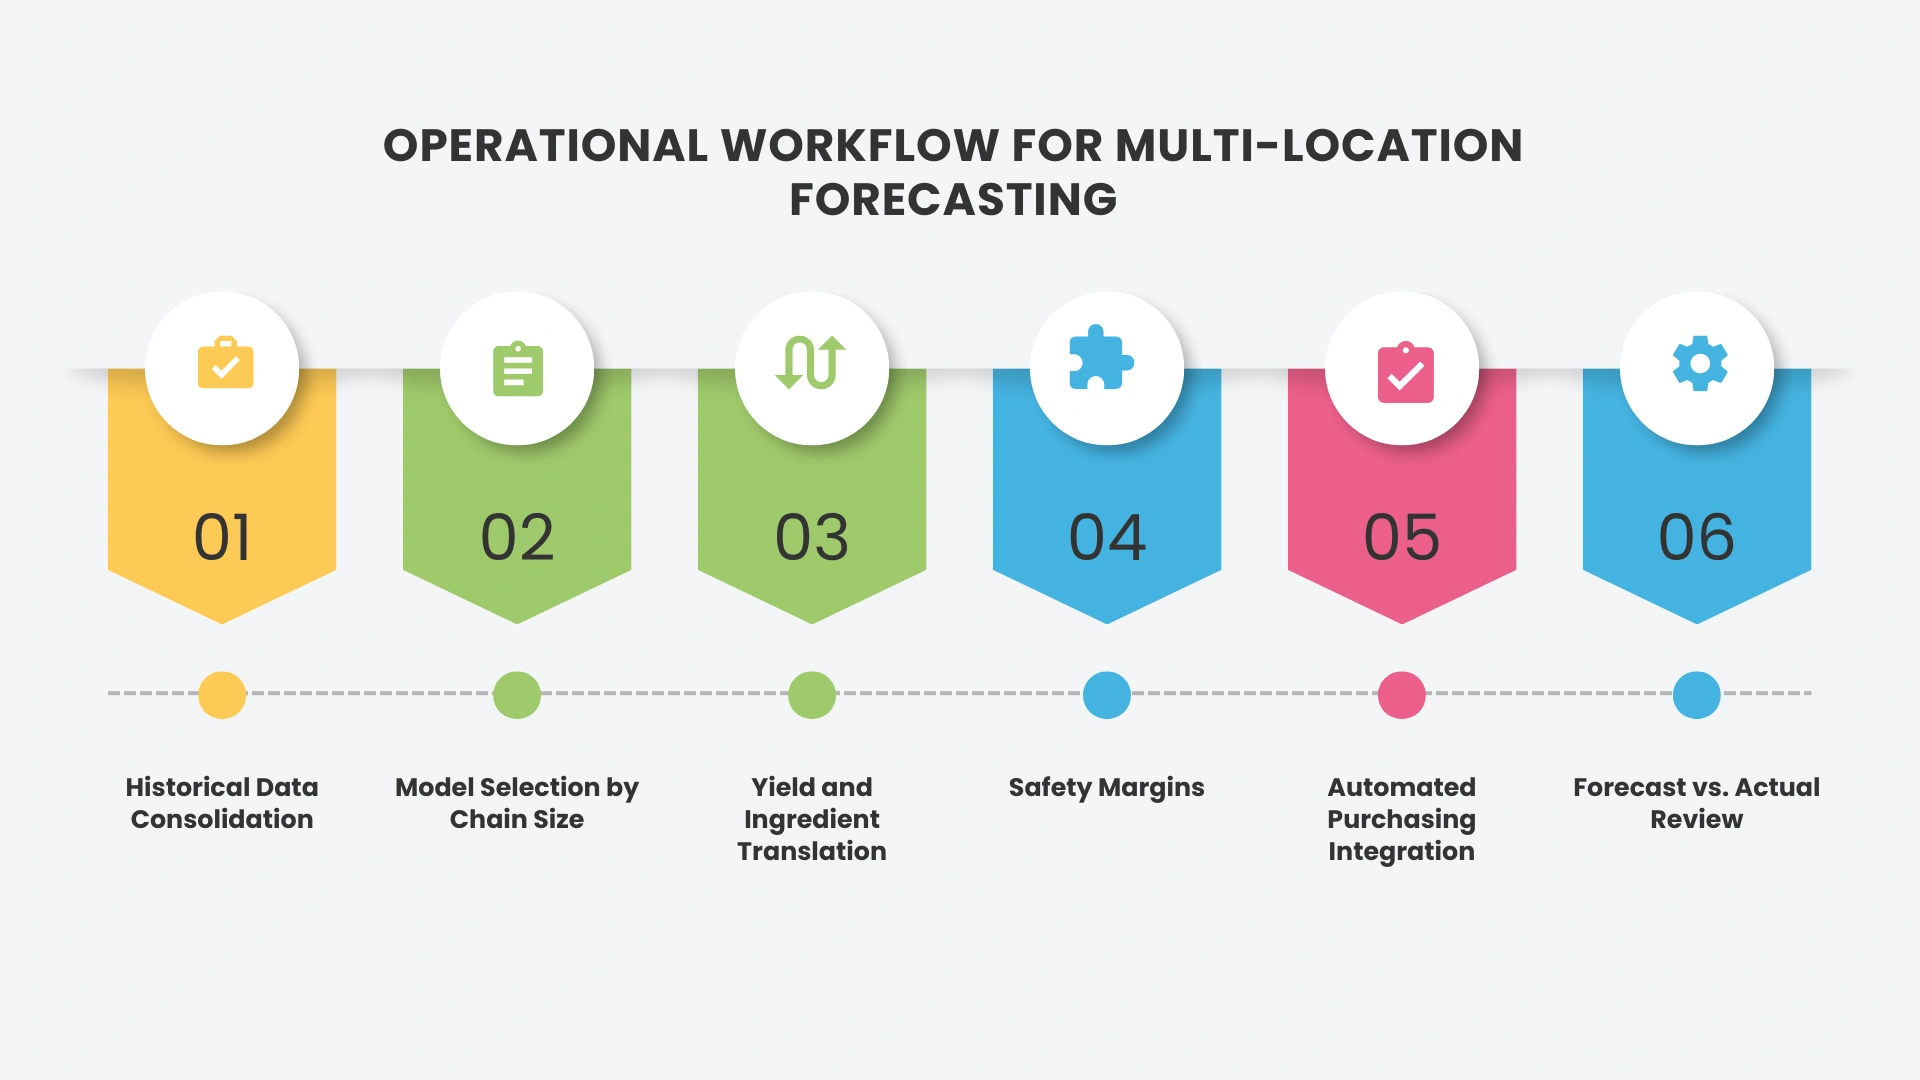
What Does the Restaurant Operations for Multi-Location Forecasting Look Like?

Knowing what to forecast is one thing. Actually running a repeatable, scalable forecasting process across multiple locations is another. Here is what a real workflow looks like:

Stage 1: Historical Data Consolidation

Before you can build a forecast, you need clean, unified historical data. In multi-location restaurant groups, more often than not, your POS systems, your inventory data, your labor records, and your external data sources are siloed by location or by department.

Integrating specialized forecasting software with inventory management, point-of-sale, customer relationship management, accounting, and enterprise resource planning systems provides restaurateurs with real-time, data-driven insights into operations, sales data, and customer behavior.

Restaurant-specific solutions typically include features such as reservation and waitlist apps, which collect, organize, and analyze valuable customer and operational data.

INDUSTRY INSIGHT

The more “quality” data, the better!

Having quality data is such a big thing because for you to expect a reliable forecast (one that accurately captures both weekly patterns and seasonality), you must first feed the model with enough history to look at, which again should be clean, consistent, and most importantly, relevant across location, channel, and daypart.

When I mentioned “enough history,” I meant you should have at least 48 to 52 weeks of data. Less than that, you can’t expect 95%+ accuracy.

Lately, there have been many advancements in forecasting strategies, data collection, and analytics technology that have made restaurant forecasting much easier and more accessible. So, if you have been using one POS or AI-powered restaurant management software for more than a year now, you don’t have to really worry about the data.

Stage 2: Choosing Restaurant Forecasting Software by Chain Size 

The right model depends on how many locations you are running and what operational infrastructure supports it.

Chain Size Recommended Model Why It Works? Tools That Fit
Small (1-3 locations) Weighted moving averages with seasonal indices Simple enough to build; captures core patterns reliably Excel/Google Sheets
Medium (3-15 locations) POS-integrated forecasting software Cross-site consistency matters at this scale Crunchtime, Restroworks, 7shifts
Large (15+ locations) AI-powered machine learning predictive analytics Multiple simultaneous data sources; continuous updating; network-level optimization Palantir, custom ML stacks, enterprise BI tools

Now, you may ask why not AI for medium-scale? Indeed, the integration of AI and machine learning in forecasting tools is making predictions more automated, precise, and valuable for long-term growth and competitiveness in restaurants. But operators in the 3–15 location range get more value from a well-configured mid-tier platform than from trying to build a machine learning model they do not have the data team to maintain.

In such cases, using specialized software can help restaurants better optimize labor scheduling, improve seating management, enhance customer service quality, and drive growth.

Stage 3: Yield and Ingredient Translation

Once you have a projected sales forecast by item, you need to translate it into actual ingredient quantities. This is where your recipe database and yield factors come in. 

A forecast that says ‘sell 240 salmon entrees this week’ needs to be more specific in terms of pounds of salmon to order, accounting for trim loss, cooking loss, and your portion standards.

Without this translation layer, your forecast never actually reaches the people doing the ordering.

And this is exactly where predictive analytics helps restaurants forecast optimal inventory levels by analyzing historical sales data and customer patterns. By using predictive analytics effectively, restaurants can reduce waste by ordering only the necessary quantities of ingredients.

Stage 4: Safety Margins

Of course, no forecast data is perfect. That’s why experts advocate for building appropriate safety margins into your ordering quantities so as to protect yourself against variance that comes along.

Here is a simple framework.

Location Volatility Profile Weekly Volume Swing Recommended Buffer Priority Items for Buffer
High volatility (tourist, event-driven) ± 20–30% 12–18% Proteins, high-velocity items
Moderate volatility (mixed urban) ± 10–20% 8–12% Perishables, specialty items
Low volatility (suburban residential) ± 5–10% 5–8% Dry goods; proteins can run leaner

Stage 5: Automated Purchasing Integration

You know what the best part of this workflow is? It connects your forecast directly to your purchasing system and automatically generates suggested orders. 

Automating inventory replenishment using predictive analytics and triggers minimizes manual errors and ensures timely restocking. 

Your managers still review and approve, but they start from data-driven decisions rather than building from scratch every week. That shift alone saves 3–5 hours of manager time per location per week.

Basically, what we’re saying is that predictive analytics allows restaurants to proactively manage supply and avoid stockouts, enhancing customer satisfaction. Integrating external factors such as weather and local events into predictive models improves inventory forecasting accuracy.

Stage 6: Forecast vs. Actual Review

Forecasting is a process, & like any process, it needs to be reviewed regularly. 

In fact, regularly reviewing actual performance against forecasted figures allows restaurant operators to adjust their forecasts and assumptions as new data becomes available. Every gap between what you predicted and what actually happened is a data point that improves your next cycle.

How Do You Forecast Cross-Location Demand Transfer?

One mistake we often hear about in multi-location restaurant forecasting is that operators assume each of their locations exists in isolation. Like for them – This is X location, that is Y location…there’s no connection in between. We wish there weren’t.

But when one outlet temporarily closes, hits capacity, or runs out of a key item, a portion of that demand walks (or drives) to your nearest location instead.

And if that nearby location isn’t already forecasting for it, they’re understaffed and under-prepped.

This is called cross-location demand transfer.

Domino’s is a good example here. Their system automatically increases staffing at nearby stores when one location hits capacity, let’s say, during a major sporting event. It helps the brand with at least a 12% higher capture rate of overflow demand.

If you can’t maintain that level of automation (and we understand most can’t), here’s what you can do instead:

  • Map your location clusters. Which locations share a trade area or are within a 10–15 minute drive of each other?
  • Flag high-risk transfer events. It could be temporary closures, local events near any location, or a location running 86’d on a high-velocity item mid-service.
  • Build a manual override protocol. Which means when Location X flags a likely overflow situation, Location Y gets a same-day heads-up to adjust their prep and staffing.

While we can’t guarantee you will capture every transferred customer this way. But even a modest improvement in readiness at the receiving location adds up significantly when you’re running 10, 20, or 50+ sites.

How Do You Translate a Sales Forecast Into Decisions Benefitting Restaurant Operations?

Here is the question: Is the forecast even changing anything before the week happens? If the answer is no, then it’s merely a reporting tool for you.

Now, here’s what you should do on priority:

First, break your revenue number into daypart (breakfast, lunch, dinner) and channel (dine-in vs. delivery).

From there, convert forecasted revenue into expected sales and item mix. This tells your kitchen what will actually move, not just how much money you expect to make.

Once you know what items you’ll sell, use your recipe yields to work out exact ingredient quantities (Don’t forget to factor in trim loss and portion standards). This was your purchasing number.

Next comes prep lists, which should ideally sync with when demand hits. Remember: Morning prep ≠ dinner prep. 

Then, build your labor plan around forecasted covers by hour or daypart.

If you run multiple locations, don’t apply one plan across all of them. The same brand can behave very differently across sites. Each outlet’s channel mix and peak hours should shape its own sales forecast and inventory management strategy.

Finally, set your safety buffers based on how volatile each location is. High-variance sites need more cushion; stable ones should run lean to protect profit margins and maintain healthy cash flow.

How Forecasting Restaurant Sales Improves Profit Margin and Customer Satisfaction?

Most of this guide has focused on predicting demand. Demand shaping is the other side of that coin, and it basically means you now don’t just forecast but put active effort into influencing customer demand so as to make peaks more manageable and, at the same time, bring in more people during slow periods.

For example, when your forecast shows that you’re going to receive fewer people on Tuesday, you now have two options:

  1. You can launch a targeted promotion through your loyalty program or delivery platform. This way, you can shift some of your weekend demand to Tuesday.
  2. Or you can adjust your prices during happy hour or run a limited-time offer on a slow daypart. This way, you move customer behavior in ways that improve both revenue and operational efficiency.

Mind that, in the first option, the keyword is targeted. Do not think of demand shaping as blanket discounting. It’s how you use predictive analytics and sales forecasts to identify precisely where small tweaks can be made so as to make a more meaningful difference in your overall cost structure.  

Mohammed Al Madani, who built a 50-store Charley’s Philly Steak operation across the Gulf, learned this the hard way:

Mohammed Al Madani on Forecasting restaurant sales

When you fill a slow service with targeted promotion, you spread your fixed costs across more covers without adding proportionally to your variable costs. The result is better profit margins on incremental revenue. 

Without an accurate sales forecast, you basically promote blindly and often to guests who would have come anyway.

How Can You Measure Your Forecast Performance?

If I had to put my finger on one thing that I genuinely believe operators forget or sometimes tend to overlook, it is that forecasting is not just about making projections but about constantly checking whether those projections were even close to reality in the first place.

Because if you’ren’t measuring forecast performance afterward, the same mistakes will keep on repeating, just keep on repeating, and now you can’t complain because you let it slip from the get-go.

That’s why tracking forecast accuracy matters so much, and here are two ways you can do so:

MAPE

One of the most common ways restaurants measure forecasting accuracy is through Mean Absolute Percentage Error, or MAPE. Yes, the name sounds unnecessarily technical, but the idea is actually pretty simple.

MAPE basically tells you how far off your forecasts were from actual sales, expressed as a percentage. So instead of vaguely saying, “our forecast felt inaccurate,” you can actually quantify that gap.

Restaurants using predictive analytics and demand forecasting models rely on MAPE a lot because it gives them a very clear benchmark for whether their forecasting performance is improving or not.

To calculate it, you can use this formula:

MAPE = (1/n) x ∑ |(Actual Sales – Forecasted Sales)/ Actual Sales| x 100

where:

n = number of periods (days, weeks, or dayparts)

For example, if your actual sales for day 1 were 10,000, and forecasted sales were 9,200. Then your error percentage for day 1 is 

| (10,000 − 9,200) / 10,000 | × 100 = 8%

If you want to calculate MAPE for 3 days, average out the error percentages. Let’s say they were 8%, 10%, and 10% for three days respectively.

MAPE = (8% + 10% + 10%) ÷ 3 = 9.33%

This means your forecast is off by ~9.3% on average. That sits in the “good” range.

MAPE Range What It Means What to Do
Below 5% Excellent: typically requires AI/ML with solid data pipelines Maintain model; focus on edge-case refinement
5–10% Good: achievable with solid POS-integrated software and a consistent process Review high-error locations; check for missing adjustment factors
10–15% Moderate: a common starting point for operators new to structured forecasting Add data sources; improve daypart and channel granularity
Above 15% Poor: forecast is not reliable enough to drive operational decisions Audit data quality; review model assumptions; consider tool upgrade

Why I think every restaurant should use MAPE is that it kind of forces you to stop treating forecasting errors emotionally. For example, if you felt like your particular month’s traffic was off, you can actually say, “Our forecast accuracy dropped by 18% over the last two weeks, and maybe X is the reason.” That makes so much more sense operationally.

Unified Scorecards and Rolling Forecasts

Beyond MAPE, your performance framework should also include a unified scorecard that tracks forecast accuracy by location, channel, and daypart every week. Because if one location constantly underperforms forecasts while the others stay relatively stable, that usually means something site-specific is happening there that the model is failing to capture properly.

Rolling forecasts here make far more sense than static annual plans because, think about it from any angle you want, but locking a forecast in January and measuring against it all year is a wrong start in itself.

A rolling forecast adjusts continuously based on actual sales data coming in every week. Which means projections always stay calibrated to current operating conditions.

Tip:

Avoid spreadsheet silos. Because when every site manages forecasting separately, there’s no way you can compare demand patterns properly, plus there is no clear network-level purchasing strategy, no ability to compare forecast accuracy across sites, and no visibility into how inventory demand is shifting across the business as a whole.

Way out? Centralization fixes that. 

At the network level, start with shared inventory purchasing. When you can see projected sales across all locations simultaneously, you can negotiate with suppliers for your aggregate volume and improve cash flow planning. 

Similarly, focus on forecasting for new locations. When you open a new restaurant, you do not have location-specific historical data. But you do have data from comparable locations in similar trade areas. Restaurants can use location-specific demand forecasting and predictive analytics to apply those patterns to new sites. That gives you a meaningful starting point for your first 90 days of operation.

What are the Common Pitfalls You Must Avoid?

Most forecasting failures play out the same way across operators of every size. Here are some of them you must avoid at all costs:

The Mistake Why It Happens What It Costs You
One forecast model for all locations Easier to manage; looks cleaner in reporting Systematic over/under-forecasting at every location with a different demand profile
Ignoring channel and daypart differences Daily totals are simpler to track Labor schedules and prep lists that are consistently wrong; waste and stockouts both increase
Treating the forecast as a reporting tool Operators look at forecast vs actual after the week closes Zero operational benefit; all the admin work, none of the value
Overcomplicating the workflow Chasing perfect accuracy with unsustainable complexity Adoption collapses; managers stop using the system; you are back to gut feel
Ignoring supply chain disruptions Operators assume supply will match the demand forecast The forecast is accurate but unfulfilling; stockouts and guest experience failures

Remember: Restaurant forecasting is more of a discipline problem than a technology failure.

When it’s working, it fades into the background. Your managers don’t have to be thinking about the forecast consciously. It is simply the process by which their week gets organized.  

That’s where the advantage compounds. Restaurant owners and restaurant managers who operationalize forecasting build a margin structure that’s consistently tighter than their competitors. 

How can you do the same? Start where you are. Get your data consolidated. Build the simplest model that works for your current scale. Review it every week. Improve it continuously. And that’s the whole process, basically.

KEY TAKEAWAYS

  • Any successful restaurant prefers to use data-driven forecasting models to make more accurate predictions, manage labor costs, and improve its overall financial management capacity.
  • One of the most common mistakes operators make when forecasting restaurant sales is that they apply one model across multiple locations, despite the fact that each location has very different demand patterns and average spend.
  • Restaurants that use forecasting to identify trends early and act on them are better able to manage cash flow, reduce waste, adjust operations, and stay aligned with what customers expect.
  • How accurate your forecasts are depends on the level of granularity at the location, channel, and daypart.
  • Historical data alone is insufficient; forecasts should take into account external factors like upcoming events, weather, and market shifts.
  • You should measure your forecast performance through MAPE and by comparing it against the actual demand. 
  • Centralized forecasting enables network-level competitive advantage, like better purchasing power and faster ramp-up at new locations.

Frequently Asked Questions

1. How do you forecast demand for a new restaurant location with no historical data?

We would suggest you tag a few of your existing restaurants that “feel” similar. Now, that’s your starting point. Adjust your findings as per what’s around the new spot. 

The first 8 to 12 weeks are going to be a lot chaotic, but treat it as a calibration phase. Check the actuals every week and keep updating.

2. How do you forecast for menu changes or new item launches?

For every new item, think about what it’s going to steal sales from. For example, if you’re preparing to launch a chicken burger, some of your customers will probably be ones who usually choose, let’s say, a cheeseburger.

For bigger menu changes, look at the category as a whole.

3. When should you override the forecast with human judgment?

Honestly, you can trust AI forecasts (especially if it’s fed on accurate and clean data to start with) most of the time, but there will always be some cases when you have some kind of information the model doesn’t. That’s when it makes total sense to override it with human judgment.

4. What is the biggest early warning sign that your forecasts are failing?

The biggest early warning that your forecasts are wrong is if you either keep over-forecasting or under-forecasting every single time. Yes, I understand errors are very normal, but, in any way you see, a 15% off every single Saturday is a whole red forest. It says that your model has a flawed assumption to begin with.

Another dead giveaway is if you’re having to manage food waste and stockouts at the same time. This suggests that while your total sales look good on paper, your mix is off. 

5. How do you sync forecasting across multiple restaurant locations?

If you’re managing multiple restaurant locations, you might first need to centralize your data. This means you should invest in a shared forecasting platform that’s capable of pulling in location-level data into one dashboard. From there, you can:

  • Compare forecast accuracy across locations
  • Align purchasing against total system demand
  • Identify where demand is “actually” shifting

6. Can ChatGPT do restaurant forecasting?

Yes, you can use ChatGPT for restaurant forecasting, but never reliably on its own, at least not in any way you’d want to run your operations on.

Newsletter subscription banner

Talk to a restaurant expert today and learn how Restroworks can help your business.

Request Demo >

Share

Discover More Insights to Power Your Journey

POS
Best bakery POS system
8 Best Bakery POS Systems & Software – Experts Pick [2026]

Here’s something interesting. The bakery industry is one of the fastest-growing adopters of management technology in foodservice, with the bakery…

Analyzing Sales Patterns in Restaurants: Improve Forecasting & Profits

Restaurants collect thousands of data points daily. Amount of orders, hours worked, inventory used, buying habits, delivery channel distribution, and…

Forecasting Beverage Sales in Restaurants: Strategies to Predict Drink Demand

There’s a very famous quote:"Companies that aren't good at budgets aren't good at predicting the future. If you're not good…

Forecasting Slow Periods in Restaurants: How to Predict Low Demand

It's 2026, and the world is turning into a scorching furnace with temperatures pushing past 45°C across multiple regions. Something…

Cloud Kitchen Packaging: Types, Ideas & Best Packaging Solutions

Here's something that will catch the cloud kitchen operator, especially the first-timer, off guard. You spend months perfecting your menu.…

Get Your Cloud Kitchen License: FSSAI Registration & Requirements

A cloud kitchen, also known as a ghost kitchen or dark kitchen, is a delivery-only food establishment. Cloud kitchens operate…

Join. Learn. Grow.

Sign up to receive the latest hospitality insights and stories straight to your inbox

Streamline your operations with Restroworks