


Restaurants collect thousands of data points daily. Amount of orders, hours worked, inventory used, buying habits, delivery channel distribution, and rush hour activity. But most of that data just gathers dust in a POS system that restaurant owners consult only when there’s a problem.
That is the gap. Not the data. The analysis.
“Embracing data, understanding market trends, and utilizing forecasting can transform a restaurant’s trajectory,” according to Deliverect. The US restaurant industry is projected to reach $1.55 trillion in sales in 2026, yet only about one in three tracked restaurant brands posted positive comparable sales in 2025, per Black Box Intelligence. The restaurants that grow are the ones making data-driven decisions, not assumptions.
What You Will Learn
- Analyzing sales patterns in restaurants
- How to achieve data-driven growth for your restaurant business.
Analyzing Sales Patterns in Restaurants
Sales pattern analysis involves carefully analyzing your sales data over time, by meal periods, products, channels, and customer demographics to find out what really works for you.
“Meals per hour sales are a great way to understand what the restaurant is producing during a certain period of time. Having a six-week moving average by meal period sales helps operators identify any trends,” says Cliff Bramble of Restaurant Informer. He also offers a concrete benchmark; full-service restaurants with sales of between $400 and $500 per square foot are underperforming or making no money. Sales per sqft over $600 or $900 and higher should earn profits well beyond average.
The first step is extracting your POS data on a weekly basis by hours of the day, category of product, and demographic of customers. The trends in sales data over eight weeks can tell you more than a year’s experience of guesswork can ever reveal.
What is Data Analytics?
Data analytics is the engine behind every useful insight a restaurant can extract from daily operations. AI-powered predictive analytics enables restaurants to quickly analyze large volumes of data to identify customer traffic patterns for sales forecasting, according to Deloitte.
A QSR chain used analytics integrated with its POS to analyze three to six months of sales data across multiple locations. The system identified slow-moving menu items, evaluated the impact of each item on overall sales volume, and provided strategic menu optimization recommendations, producing improved sales and profitability within the same analysis window.
Data Analysis
Effective data analysis requires a consistent structure, not complexity. Most actionable insights can be extracted from basic POS reports, provided data accuracy is maintained.
The core of good data-driven decision-making is comparing historical data against what is actually happening. Sales forecasting only improves when actual sales are consistently measured against projected figures and the gap is analyzed for causes.
Ama Cafe used hourly sales reports to identify that their 9 to 10 PM window showed a high sales drop-off. Acting on that data, they extended closing time by 30 minutes and captured revenue previously being lost simply because the operation had closed before customer demand tapered off.
Centralizing data storage across ordering channels, inventory records, and customer feedback allows for more comprehensive data analysis of business operations. When those streams sit in separate systems, identifying the correlations that drive performance becomes nearly impossible.
What is Inventory Management
It is through the inventory that sales pattern analysis makes its greatest impact on financial aspects. In knowing what sells prior to placing orders, there would no longer be unnecessary purchases and instances of understocked materials.
Predictive analytics allows restaurants to forecast future demands and plan their inventory management by using past sales performance as well as other factors, including seasonality and anticipated sales on account of local promotions and special events.
INDUSTRY INSIGHT
Inventory Data
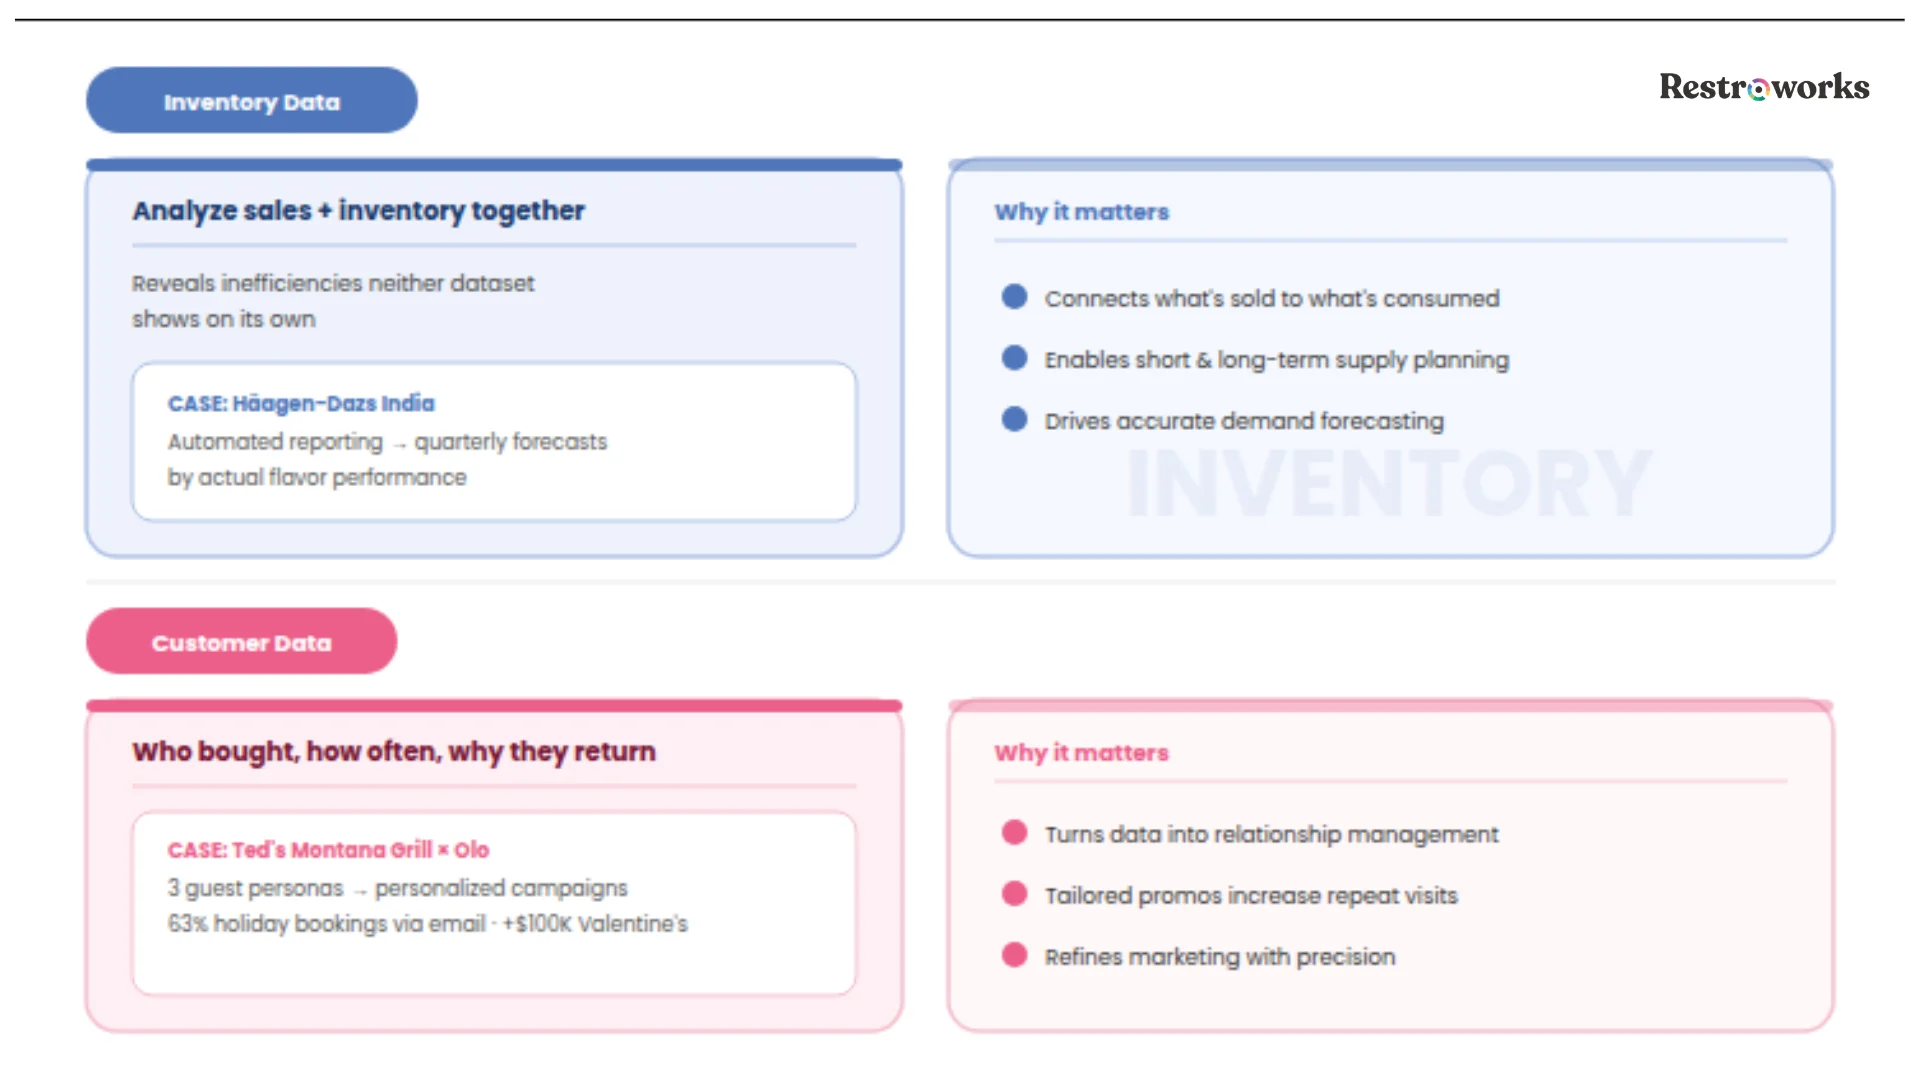
Inventory data and sales data should always be analyzed together. The relationship between what is being sold and what is being consumed reveals inefficiencies that neither dataset shows on its own.
Customer Data
Customer data turns operational analysis into customer relationship management. Understanding not just what sold but who bought it, how often they return, and what influences their decisions allows restaurants to refine marketing strategies with precision.
Ted’s Montana Grill implemented guest analytics through Olo, identifying three key guest personas and building personalized campaigns around each. The result was 63% of holiday reservations driven by email campaigns and a Valentine’s Day revenue increase of $100,000 above their five-year average. Their 2025 was described as their best year yet.
By analyzing customer spending patterns and purchase history, restaurants can tailor promotions and menu offerings to individual customer preferences, improving both customer experience and repeat business.
What is Forecasting Sales?
Forecasting sales is the direct application of all the data analysis described above. It uses historical sales data, customer behavior patterns, seasonal trends, and external factors like local events and weather to generate accurate predictions about future sales.
March 2026 restaurant industry data showed sales growth of plus 0.7% while customer traffic declined by minus 2.3%, per Black Box Intelligence. Sales growing while traffic falls means the average order value is rising from price increases rather than volume. That distinction is critical for forecasting sales accurately and planning marketing efforts around it.
An unnamed QSR doubled its sales index on DoorDash (from 2.4 to 4.8) and nearly doubled on Uber Eats (from 2.67 to 5.86) after implementing delivery analytics that tracked availability and discoverability alongside sales data. The analysis found that just 2.6% unavailability caused a 26% drop in the sales index, demonstrating how granular demand forecasting at the channel level can directly increase sales.
What is Predictive Analytics
Predictive analytics uses historical sales data, machine learning, and external data inputs to generate forecasts about what will happen rather than just explaining what did.
Predictive analytics allows restaurants to tailor marketing strategies based on anticipated customer preferences and behaviors. Restaurants that implement predictive analytics can achieve greater profitability through improved operational efficiency, with the ability to prepare the right staffing, menu items, and inventory before peak periods arrive.
Captain D’s partnered with Tango Analytics to use predictive analytics and mobile movement data for site selection. By analyzing customer travel patterns and market demographics, they developed three new store prototypes optimized for different market conditions, reducing market cannibalization through predictive modeling.
A Texas casual dining restaurant achieved $2,500 in monthly new revenue and 5x ROI over a 13-month analytics engagement through sustained customer behavior analysis and operational efficiency improvements.
What is the Importance of Customer Feedback
Customer feedback is one of the most underused data sources in restaurant sales pattern analysis. Transaction data shows what customers bought. Customer feedback shows why they came back or did not.
Integrating customer feedback with sales data allows restaurant managers to connect service quality scores and review sentiment to specific shifts, menu items, or staffing patterns. When a sales report shows a Thursday dinner service consistently underperforming, customer feedback from that period may reveal a service quality issue that the revenue number alone would never surface.
Mohammad Al Madani, a franchise operator interviewed on Restrocast, learned that promotions without data analysis can undermine both sales patterns and brand positioning:

What is Demand Forecasting
Demand forecasting connects sales analytics to operational planning. Accurate demand forecasting in the restaurant industry is critical for optimizing inventory management, minimizing food waste, and enhancing profitability, according to PubMed research published in 2025.
A $2 billion casual dining chain improved Adjusted EBITDA from 23% to over 27% after comprehensive data analysis identified operational bottlenecks, including understaffing during peak periods and menu misalignment. The combination of demand forecasting and operational data analysis produced a 4-plus point EBITDA improvement on over $1 billion in annual sales.
What is Market Analysis
Market analysis through sales pattern data reveals whether underperformance is operational or structural. Fast casual restaurants showed a trailing four-week average year-over-year sales growth of plus 4.21% while full service restaurants achieved just plus 0.97% at the end of March 2026, per MarginEdge. Knowing your segment benchmark makes your own restaurant’s performance meaningful rather than abstract.
EXPERT INSIGHT