
Burger Restaurant Market Size and Revenue Performance
A. Global and Regional Market Valuation
Burger restaurants represent one of the largest single menu-led categories within foodservice, particularly in the U.S., where burger-focused chains dominate quick-service restaurants by both unit count and sales volume.
- The U.S. burger restaurant industry was valued at approximately $172 billion in 2024, reflecting its scale as a standalone category.
- When measured as a distinct hamburger-focused foodservice segment, the global hamburger market is estimated at around $82.6 billion in 2024, with projected growth at 5.6% to reach $150.4 billion by 2035.
- Burgers operate within the global quick-service restaurant channel, which generates over $1.16 trillion annually, emphasizing the category’s reach and demand among customers.
B. Growth Rates and Revenue
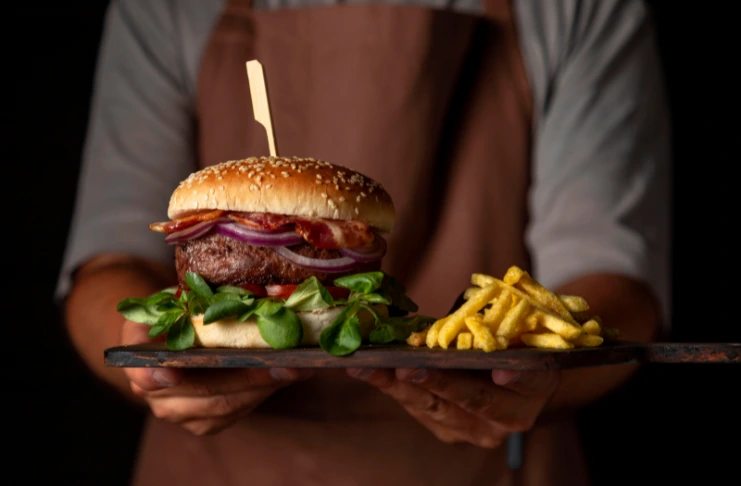
Revenue in burger restaurants has grown steadily, driven by pricing and consistent customer traffic.
- U.S. burger restaurants have posted low single-digit annual growth (approximately 3-4%) over the recent five-year period.
- Post-pandemic revenue gains were supported more by menu price increases and value-tier demand than by new-store openings.
C. Revenue Distribution by Restaurant Format
Burger sales vary across restaurant formats, with most revenue coming from quick-service outlets.
- Quick-service burger chains generate the largest share of sales, supported by high order volume and standardized menus.
- Fast-casual and premium burger brands make up a smaller share of locations but often report higher average unit sales, especially in dense urban areas.
- Casual dining restaurants have burgers as a core menu item, though sales are spread across a wider mix of entrées.
Key Burger Trends: Consumer Demand Patterns and Behavior
Ongoing customer demand is helping keep burgers popular across different restaurant formats. Here are the key burger trends among customers-
- High purchase frequency: Many customers order burgers multiple times a month, especially from quick-service restaurants. Fast service, familiar pricing, and predictable taste make burgers an easy repeat order.
- Interest in alternatives: Plant-based options get attention, particularly among younger diners, but classic burgers such as beef burgers remain the most common choice.
- Flexible ordering behavior: People no longer order burgers through just one channel. Orders shift between dine-in, takeout, drive-thru, and delivery based on time, location, and convenience.
- Generational differences in expectations: Younger customers tend to focus on speed, ease of ordering, and consistency, while older customers often prioritize familiarity and stable pricing.
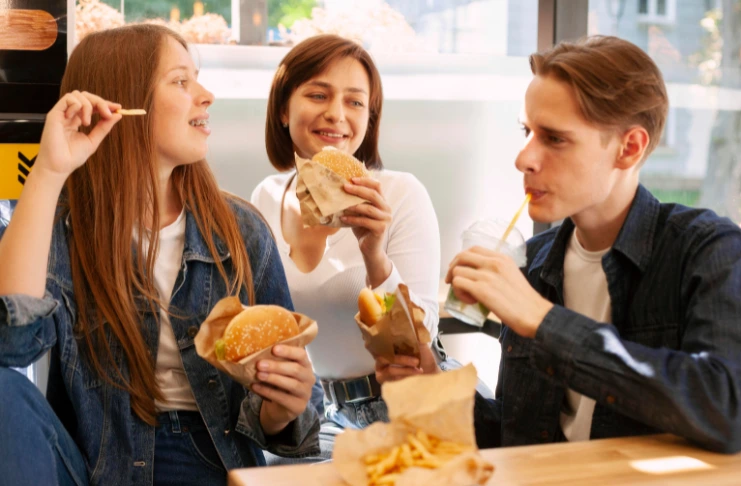
The data below shows how these preferences translate into actual ordering behavior.
- Conversations around burgers on social media have increased 21.91% year-over-year.
- 38.75% restaurants in the US feature burgers on their menus.
- About 65% of people in the U.S. and similar markets consume fast food at least once per week, showing the regularity of quick, dine-out meals that often include burgers.
- Dataessential’s report reveals that around 76% of people have consumed it within the last week.
- Burgers rank as one of the most popular American dishes, with 98% of U.S. adults having heard of hamburgers and cheeseburgers, and 83% viewing them positively.
- In YouGov’s list of American dishes, hamburgers are ranked third in popularity among all listed foods.
- Estimates suggest Americans consume around 50 billion burgers per year, reflecting sheer demand volume.
- According to Google Trends data, people in Oregon eat roughly 78 burgers per person annually, indicating significant regional consumption volumes.
- The plant-based burger restaurant market was valued at around $7.2 billion in 2024, highlighting demand for healthier burger options.
Burger Restaurant Statistics: Channel and Format Insights
Burger ordering behavior is closely tied to format choice. Patterns across QSR reporting, consumer surveys, and chain disclosures show how burger appeal is distributed in practice-
A. Quick Service Restaurants (QSR)
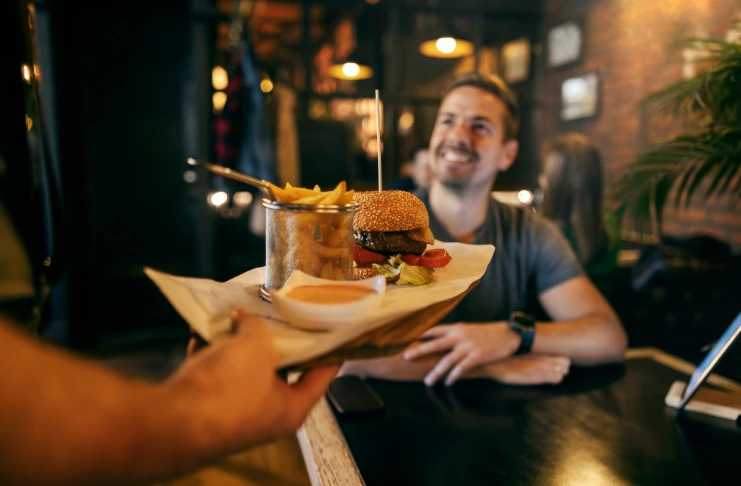
Most burger transactions take place in quick-service formats, where burgers are designed for speed, volume, and repeat purchase. Quick service restaurants account for roughly half of the global fast-food market share, with “burgers and sandwiches” leading that product category at around 38.1% share in 2024.
- Online ordering dominates QSR sales overall, with drive-thru and pickup accounting for the largest share of transactions at burger-focused chains.
- Burger items perform especially well in QSR because they are standardized, affordable, and easy to bundle.
B. Drive-Thru, Delivery, and Digital Ordering
In burger-focused QSRs, drive-thru and digital ordering make up the majority of orders, together contributing to more than 70% of revenue at leading brands. Delivery plays a smaller role for burgers than for pizza, mainly due to price sensitivity and how well burgers travel.
- Drive-thru supports the highest burger transaction volumes.
- Delivery is used selectively, often for bundled meals rather than single items.
- Digital ordering underpins both channels, with mobile apps and loyalty programs influencing order frequency and basket size.
C. Full Service Restaurants
In full-service restaurants, burgers are commonly ordered as entrées, with at least 45% of consumers ordering them in fine dining restaurants.
- Burger orders are concentrated during lunch and casual dinner occasions.
- Channel choice is overwhelmingly dine-in, with limited off-premise contribution.
Which Burger Brands Control the Most Sales and Scale?
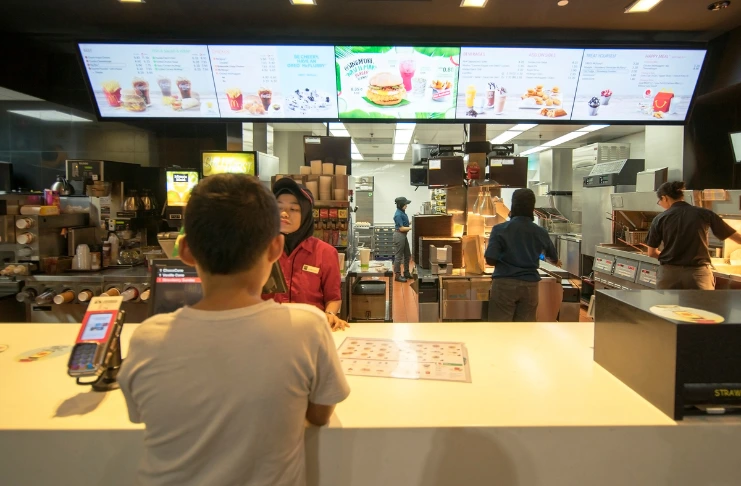
A small number of burger-focused brands account for a large share of global burger revenue. Looking at their systemwide sales, store footprint, and per-store performance helps explain how concentrated the category has become and why scale continues to matter in the burger business.
1. McDonald’s
McDonald’s is the single largest player in the global burger offerings, operating at a scale no other burger-focused brand comes close to. Its performance is driven by volume, density, and international reach rather than premium pricing.
- Systemwide sales (2023): $53.5 billion
- Total outlets: 34,000 globally
- Global vs domestic split: 60% of restaurants are located outside the U.S.
2. Burger King
Burger King operates one of the widest global burger footprints, with growth largely driven by international franchising. Its scale comes from unit count rather than high per-store volumes.
- Systemwide sales (2024): ~$11 billion
- Total outlets: ~19,000 globally
- Average unit volume (US): $1.63 million
- Global vs domestic split: Majority of locations outside the U.S.
3. Wendy’s
Wendy’s represents a more U.S.-concentrated burger model, with higher average unit volumes than many global peers. Its performance reflects strong domestic demand in a mature burger market.
- Systemwide sales (2024): $14.5 billion
- Total outlets: 7,200+ outlets globally
- Average unit volume: ~$2.1 million per store at the end of 2024.
4. Five Guys
Five Guys shows how fast-casual burger brands scale differently, relying on high sales per store rather than dense networks. Despite a much smaller footprint, it generates substantial revenue.
- Estimated systemwide sales: $2.27 billion
- Total outlets: 1,900 locations
5. Shake Shack
Shake Shack operates at a much smaller scale than QSR giants but posts some of the highest per-store sales in the burger category. Its model is built around premium positioning and urban density.
- Systemwide sales (2023): ~$1.3 billion
- Total outlets: 655 globally
- Average annual sales per outlet: $3+ million
Conclusion
Burger restaurants continue to hold a unique position in foodservice because demand is built on habit, scale, and accessibility. Burger demand concentrates around a small number of large brands, flows primarily through quick-service and drive-thru formats, and holds up because consumers return to the same items across different occasions.
That combination of scale, frequency, and channel flexibility explains why burgers continue to generate dependable sales.