
How Historical Sales Data and Past Sales Data Help Build an Accurate Forecast?
For restaurant sales forecasting, you usually need two types of information.
First, there’s quantitative data that includes historical sales figures, customer counts, average check sizes, and revenue by day and daypart.
Next, there’s qualitative data. It comes from customer surveys, local event schedules, weather forecasts, etc.
While most operators focus almost entirely on the first type, it’s common sense that a strong sales forecast would need both.
Now, the big question –
How Can Restaurant Owners Use Data to Start Forecasting Restaurant Sales “Accurately”?
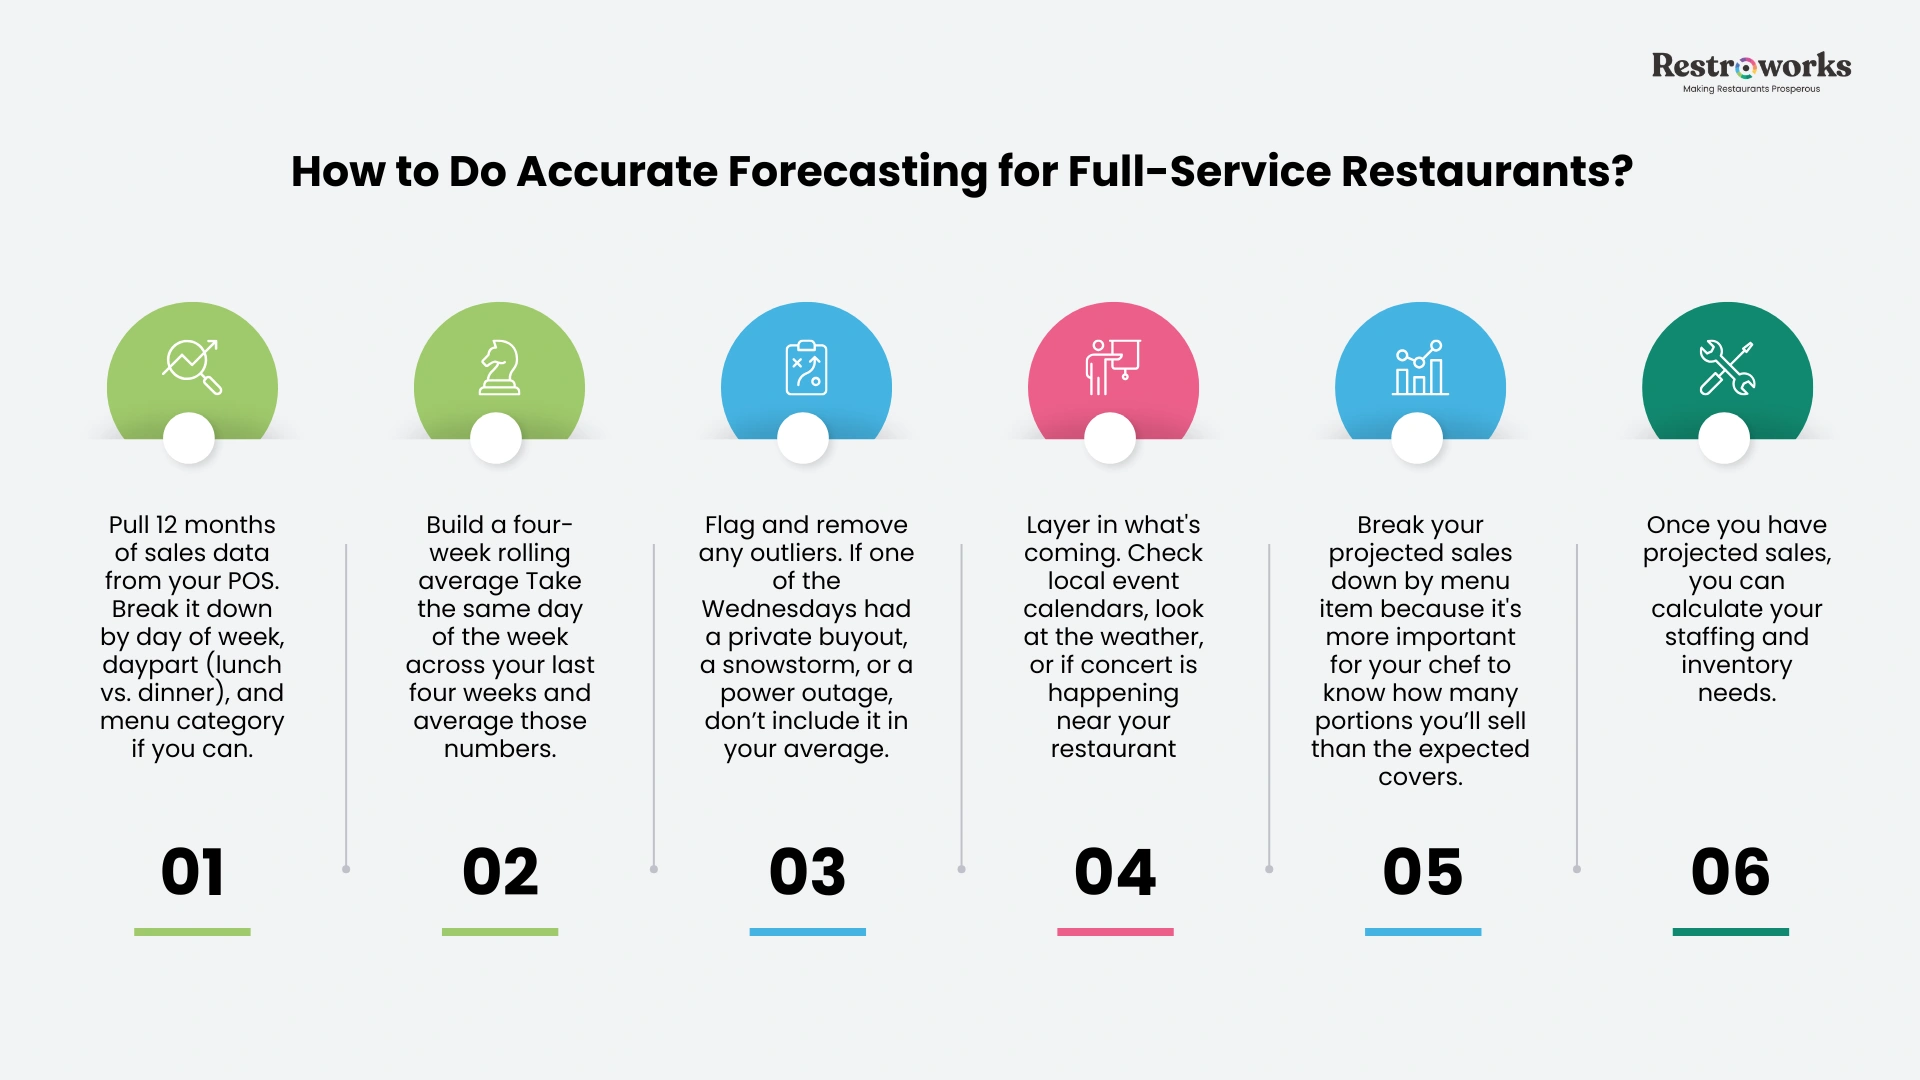
Let’s get practical. Here’s how most successful full-service operators build their weekly forecasts, step by step.
Step 1: Pull at least 12 months of sales data from your POS systems. Break it down by day of week, daypart (lunch vs. dinner), and menu category if you can.
Try to look for patterns: which days consistently receive the highest footfall, or when is your kitchen relatively slower, or how a particular holiday influences customer behavior.
Step 2: Then, build a four-week rolling average as your baseline. Take the same day of the week across your last four weeks and average those numbers.
Basically, your forecast for next Wednesday is the average of the past four Wednesdays. Yes, it’s not perfect, but it’s a grounded starting point.
Step 3: Flag and remove your outliers. That means if one of those four Wednesdays had a private buyout, a snowstorm, or a power outage, don’t include it in your average.
Strip away the anomalies and work from your ‘ordinary’ weeks only.
Step 4: Layer in what’s coming. Check local event calendars, look at the weather, or see if a 5,000-person concert is happening near your restaurant next Saturday. Each of these factors will impact your sales.
Step 5: Break your projected sales down by menu item. Why? Because knowing you’ll likely do 90 covers doesn’t help your sous chef much, but knowing you’ll likely sell 30 portions of the braised short rib does.
Step 6: Convert those numbers into staffing and inventory needs. Once you have projected sales, you can calculate the labor hours needed, what to order from your suppliers, and how much to prep each morning.
And there you have your entire process laid out!
How Forecasting Sales Helps Restaurant Managers Improve Customer Traffic Flow?
Most full-service operators do track table turn time after the service. No, it’s not wrong, but try doing it before the shift.
Why do we recommend this? See if your forecast tells that you’ll have 90 covers on a Friday night, it means:
- At 45 minutes per table, you can easily cycle through those covers across the service window.
- But at 75 minutes per table, the same 90 covers will result in frustrated customers and unmanageable waitlists.
So what should you actually do with this?
First, break down your average turn time by –
- Daypart
- Party size
- Service conditions (peak vs off-peak)
Once you have that, layer it into a simple capacity view alongside your cover forecast:
Projected Revenue per Seat = (Average Check Size × Covers) ÷ Available Seat-Hours
If your forecast shows a busy Friday but your projected turn time suggests you’ll only cycle each table 1.8 times instead of your usual 2.2, you’ll likely lose money. And that’s exactly your cue to tighten the floor plan, add a runner, or adjust your reservation pacing.
On the flip side, try deliberate turn time management during slow periods. When your forecast shows a slow Tuesday dinner, a slightly longer average turn time can increase your average check enough to partially offset the lower cover count.
That’s demand shaping applied at the table level.
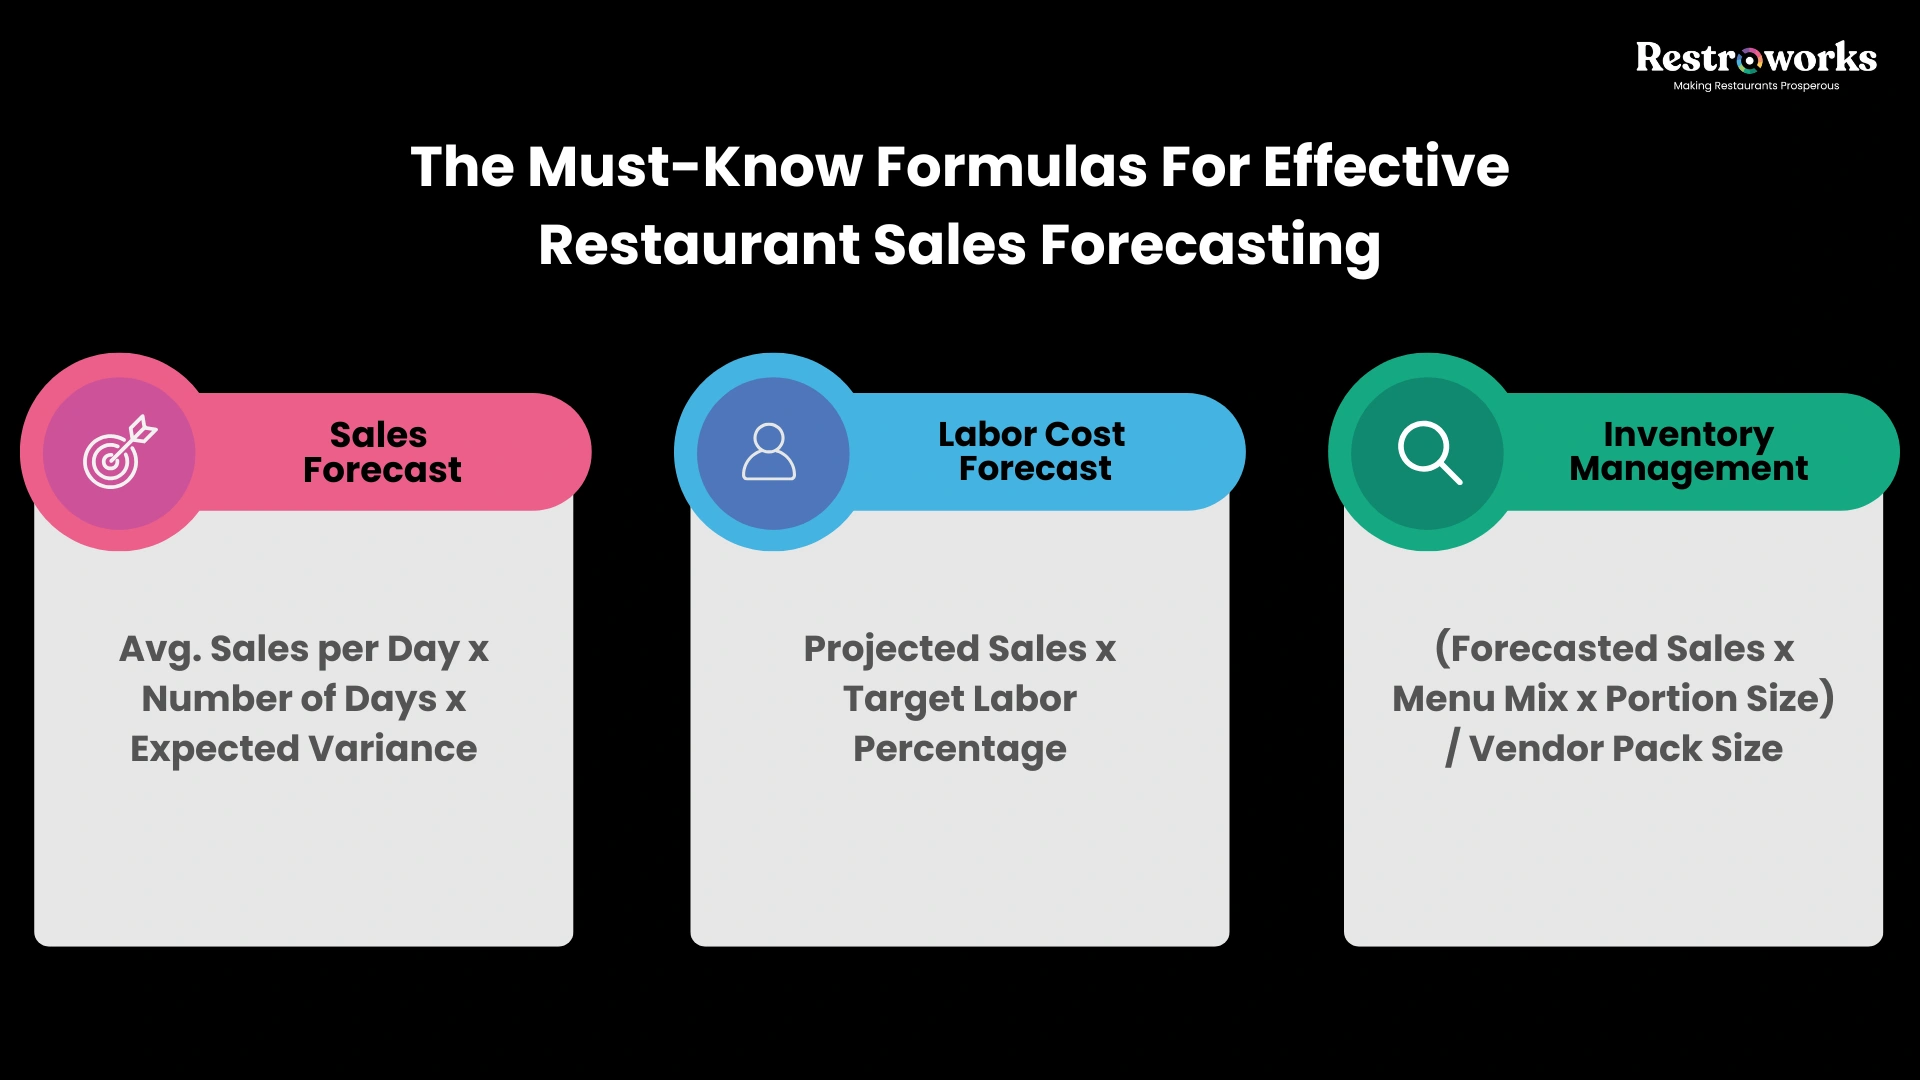
The Must-Know Formulas For Effective Restaurant Sales Forecasting
You don’t need to be a financial analyst to run solid forecasts or for better financial management. Below are a few formulas that make the restaurant forecasting process a bit simpler for you to use every week:
Let’s take one example of each:
Sales Forecast
Your restaurant averages $1,500 per day. You’re forecasting sales for a 7-day week, and a local event happening that week is expected to increase demand by 10%. This gives you –
1,500 × 7 × 1.10 = $11,550 projected weekly sales
Means, while your base week would have been $10,500. The event lifts your expected demand by 10%.
Labor Cost Forecast
Drawing from the above example, your projected sales are $11,500. And let’s say your target labor percentage is 30%. So, you get –
11,550 × 0.30 = $3,465 labor budget
This is your guardrail. Staff above this, and your margins will tighten. Staff below it, and service quality will most likely be at risk.
Inventory Need
For this, let’s say your:
- Forecasted sales: $11,550
- 25% of revenue comes from burgers
- An average burger uses 0.25 lbs of beef
- Vendor pack size: 5 lbs
- Avg burger price: $12
Using formula –
$11,550 × 25% = $2,887.5 from burgers
2,887.5 ÷ 12 = ~241 burgers expected
241 × 0.25 lbs = 60.25 lbs of beef needed
60.25 ÷ 5 = ~12 packs to order
You may ask why we didn’t use the formula for inventory need “as is.” Well, that’s intentional because while the formula suggests otherwise, you can’t multiply revenue directly by portion size without first converting it into units sold. That’s what we did above.
Mind that the inventory need formula only works if your recipes are standardized. That means every menu item has a documented ingredient list with precise portion sizes. Without that, you’re estimating, and estimation leads to over-ordering, spoilage, and inflated food costs.
For every dollar invested in better ordering and inventory management, restaurants can typically save around seven dollars in reduced waste and cost. That’s a 600% return on investment.
Short, Medium, and Long-Term Sales Forecasting: What Does Each One Entail?
Every forecast serves a different kind of purpose in your restaurant operations. For example, some tell you how to “survive” a particular week; some are about how you cannot get blindsided the next month, too; and some are like “Do this/Don’t do that if you don’t want to lose $200,000 this year.”
Here’s how to think about all three.
Short-Term Forecasting
This covers the next day or the next week. It’s your most operational forecast. Basically, the one that drives how you’ll schedule staff, your daily prep lists, and supplier orders. Accuracy here has an immediate and direct impact on your food and labor costs.
A good short-term forecast answers questions like:
- How many servers do I need on Thursday evening?
- Should I order an extra case of salmon for the weekend?
- Will tomorrow’s lunch be slow enough to run with a two-person prep team?
One thing worth mentioning here is that lunch and dinner are not just different time slots. They basically require structurally different forecasting models.
Lunch in a full-service restaurant, for example, is driven by time pressure. Your guests have somewhere to be. That means cover count, table turn speed, and kitchen throughput matter more than average check size. That’s why, if you’re forecasting future sales, let’s say, for your Tuesday lunch, it must answer: how many covers in a 90-minute window, and can the kitchen move that fast?
For dinner, demand is more discretionary, dwell time is longer, and average check size is your primary revenue lever. What you should focus on then is per-table spend.
If you run a weekend brunch, it is a completely separate model in its own right.
Brunch demand is highly weather-sensitive, heavily influenced by neighborhood demographics, and tends to compress into a much shorter service window than either lunch or dinner. Make sure you account for that.
A simple way to go? Maintain three separate rolling averages [one for lunch, one for dinner, one for brunch]. Never blend them into a single daily figure.
Medium-Term Forecasting
Looking a month out gives you room to plan promotions, adjust your staffing model, and make smarter purchasing decisions. If your historical sales data shows March is reliably 15% stronger than February, you can hire and train new staff before the rush.
This is also where you plan your marketing. A slow period you can see coming is a slow period you can actually do something about, whether that’s a prix-fixe promotion, a private dining push, or a social media campaign to drive covers.
Long-Term Forecasting
Quarterly and annual forecasts are less about day-to-day decisions and more about setting your business’s direction. Should you renovate the private dining room? Is it the right time to open a second location? Can you afford to add a pastry program?
Making informed decisions requires solid historical data across at least two years, along with a clear picture of your cash flow and profit margins.
In all, with long-term forecasting, you’re making sure your big bets are grounded in real numbers.
What are Some of the Forecasting Mistakes That You Must Avoid?
Honestly speaking, most restaurant operators do make these mistakes. In fact, we have personally talked to some. For example:
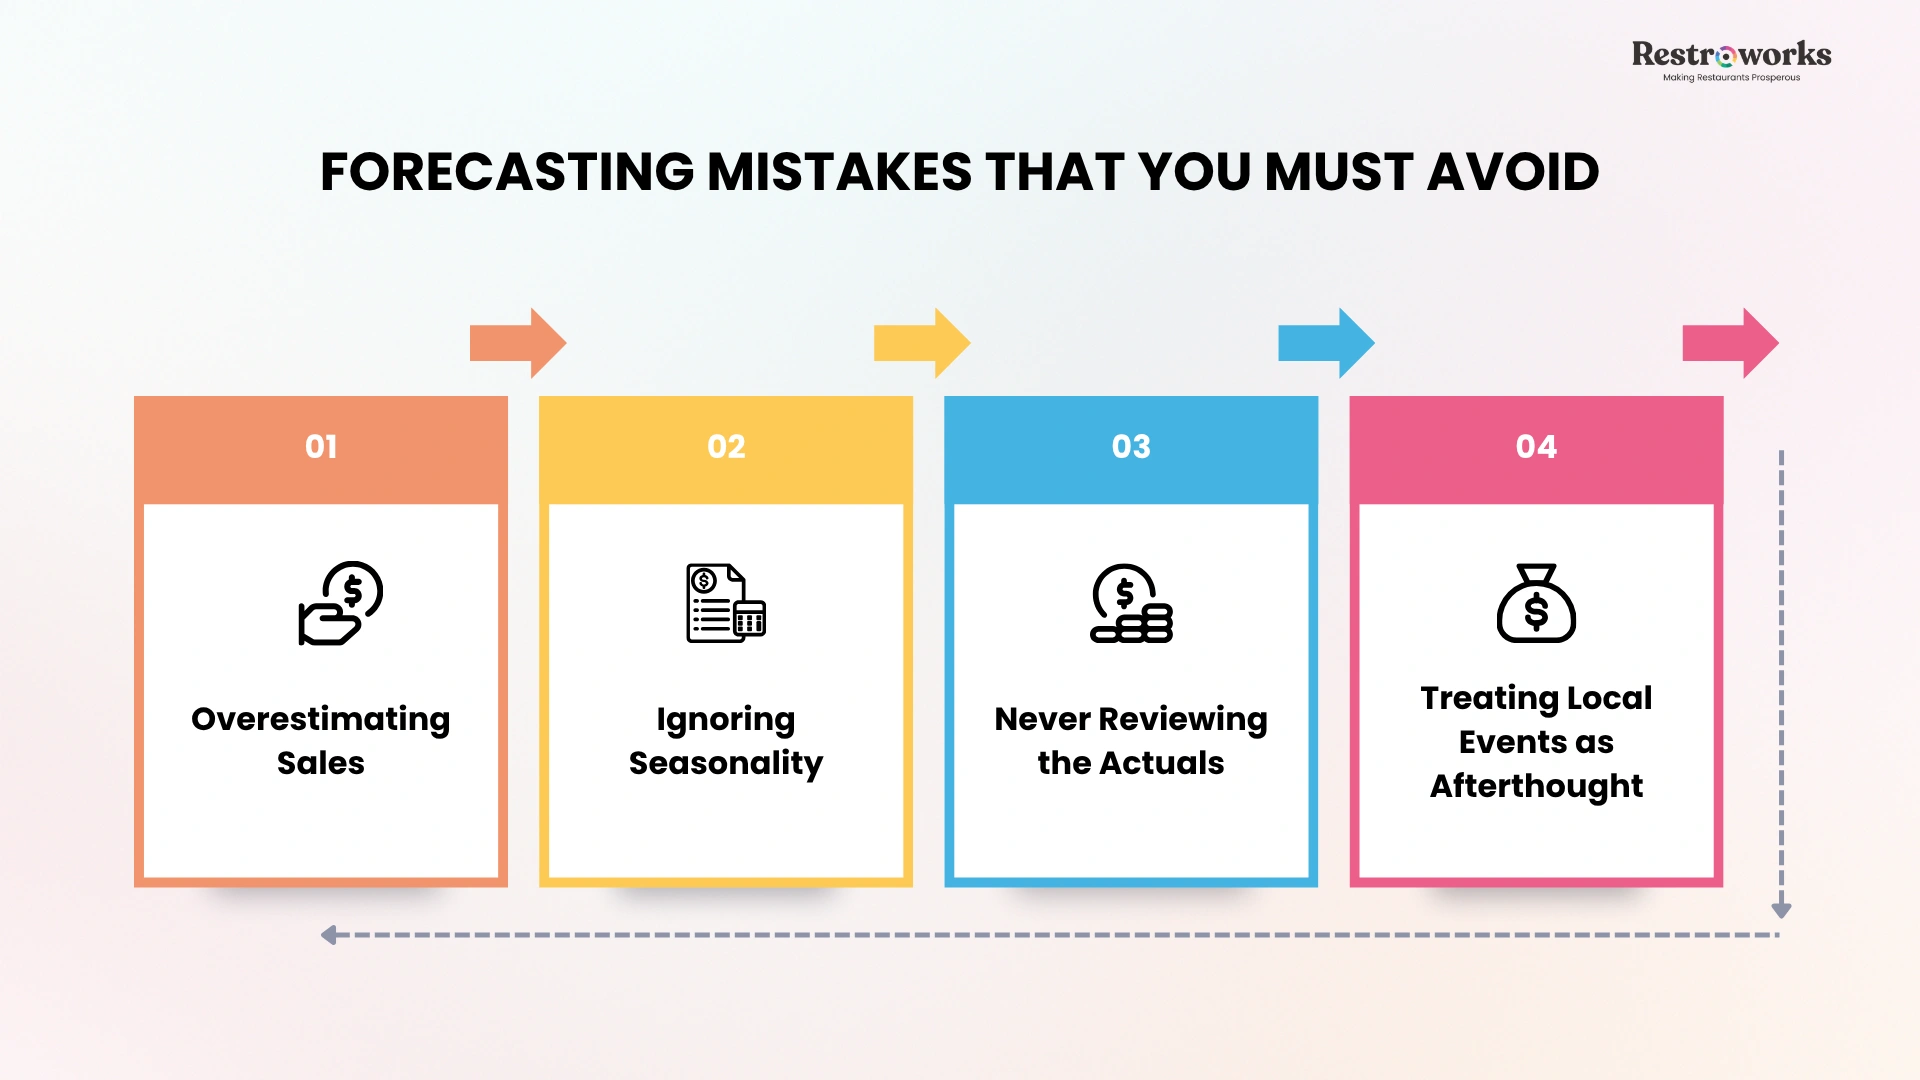
Mistake #1: They Overestimate Sales
This is the most common trap. When you’re optimistic about upcoming events, you tend to over-hire, over-order, and then watch your food costs and labor costs spike on a week that came in 20% below your projection.
Mistake #2: They Ignore Seasonality
If you budget for your busy-season revenue all year, you’ll constantly be short during your slow periods and unprepared for the gaps.
For example, Full-service restaurants near colleges, tourist destinations, or seasonal attractions can see dramatic swings between their busy and slow periods. That’s why it’s better if your forecast syncs with the “actual” reality than what you wished for.
Mistake #3: They Never Review the Actuals
A forecast you don’t compare to what actually happened is merely a guess with a timestamp; that’s it. As Chris Incorvati, CTO of Jack’s Family Restaurant, puts it, “We’re so in a rush to get things out the door and get it in, we lose track of why we did it in the first place.” That’s the gap. Forecasts get made, but rarely interrogated.
The most valuable thing you can do each week is pull your actual sales against your projected sales and ask: where were we off, and why? That habit is how you build a forecasting process that actually improves over time.
Mistake #4: They Treat Local Events as an Afterthought
A nearby concert, a marathon, a holiday weekend — all of these affect customer traffic in ways your historical averages can never capture automatically.
Better is to build a habit of checking local event calendars every week when you’re setting your forecast. The restaurants that do this consistently are the ones that show up fully staffed when everyone else is scrambling.
What Tools Can You Use for Accurate Restaurant Forecasting?
So, there are two realistic options for most full-service operators, and both have a place depending on where you are in your business.
1. Spreadsheets
If you run a smaller operation, you can actually rely on Excel or Google Sheets to some degree, at least the degree to which you’re ready to put in the manual labor.
To begin, you can set up a four-week rolling average, put your actuals against your sales projections, and use labor cost formulas to track the weekly data.
The upside here is that you have full control over the entire process. The downside, though, is that first you have to invest a lot of time, and second, that manually feeding data tends to be approx 35% less accurate than software-powered forecasting, largely because humans miss patterns in complex datasets.
2. Restaurant Forecasting Software
Dedicated platforms pull directly from your POS systems, layer in weather data and local event information, and update your forecasts in real time.
Some can even generate accurate forecasts up to 21 days out while factoring in dozens of variables at once.
The results are meaningful. Operators who switch from manual forecasting to software typically see labor costs drop by 5–10% and a measurable reduction in food waste and spoilage.
That’s how the monthly cost of the software usually pays for itself within the first few weeks.
💡Take Chili’s, for example. After implementing AI forecasting across their 1,600 locations, they reported
- Improved scheduling accuracy by 20%
- Saved approximately 600 labor hours per week across their network
- Plus, their managers saved around 30 minutes per location per week.
Basically, the idea behind using technology for forecasting sales is that “You’ve got to make sure that you’re evaluating every possible scenario of how things are going to be handled,” says Chris. And that’s what restaurant tech is there for. “Right” forecasting tools can automate data collection and analysis, improving the accuracy of sales projections.
Remember: Proactive forecasting isn’t just a financial tool. It’s how you protect service quality. When your staffing matches actual demand, your team isn’t overwhelmed. When your kitchen isn’t over-prepping, food quality stays consistent. Those things show up in reviews, repeat visits, and long-term revenue.
How Can You Make Restaurant Sales Forecasting Your Weekly Habit?
We can say it a hundred times over (and even more) that you won’t benefit from forecasting in any way if you don’t make it a weekly practice. How to do it right? Listen here:
On Monday morning, first and foremost, compare last week’s actual sales to your projections. Where were you off? Was it the weather, a local event, or any change you recently introduced during the menu planning? Document it.
Then review the upcoming week. Check for local events, look at weather patterns, and flag anything that might shift demand up or down.
Accordingly, update your forecast. Adjust your projected sales based on what you’ve learned and what’s coming. Then convert those numbers into a staffing schedule and a purchasing order.
Most importantly, share it with your team. Your managers need to be working from the same numbers you are. When the forecast is shared, accountability follows naturally.
Remember: In a restaurant business where margins run between 3% and 5%, the difference between guessing and knowing is the gap between viability and decline.
Restaurant forecasting doesn’t promise you’ll see the future. It just makes sure you’ve done everything possible to prepare for it. In a way, forecasting helps restaurants achieve sustainable growth and better operational efficiency by minimizing wasted resources without diminishing customer service.
And in full-service, that preparation shows up in every shift — in the food that doesn’t spoil, the server who isn’t overwhelmed, and the guest who doesn’t wait too long for their check.