
Every bakery business already has access to valuable data. Every sale, canceled order, stock refill, customer preference, and wasted batch gives you insight into how the business is performing.
The only problem? This data is of no use if it stays buried inside your POS system, spreadsheets, or disconnected systems. Looking at these numbers individually will only tell you part of the story.
Then comes data analytics. It helps you turn day-to-day operational data into information you can actually use. Equipped with insights, you can identify areas for improvement, like where most waste happens, and take steps to fix it.
Here’s all you need to know about data analytics for bakery businesses and how to implement it the right way.
What you will learn
- Why does data analytics matter for your business?
- Which areas of your bakery will benefit the most from data analytics?
- The steps to implement data analytics and KPIs to track
Why Data Analytics Matters for Bakery Businesses?
In many cases, what seems like an operational challenge is just another data issue.
For example, inaccurate demand forecasting and poor inventory tracking were causing excess waste, while you assumed it was simply overproduction. Similarly, your inventory purchasing cycles might be inconsistent, which may be leading to cash flow issues for the business.
In both these cases, having access to accurate, real-time data would have helped identify or avoid these issues altogether. That’s why you need data analytics to connect information across sales, inventory management, procurement, production, and customer behavior.
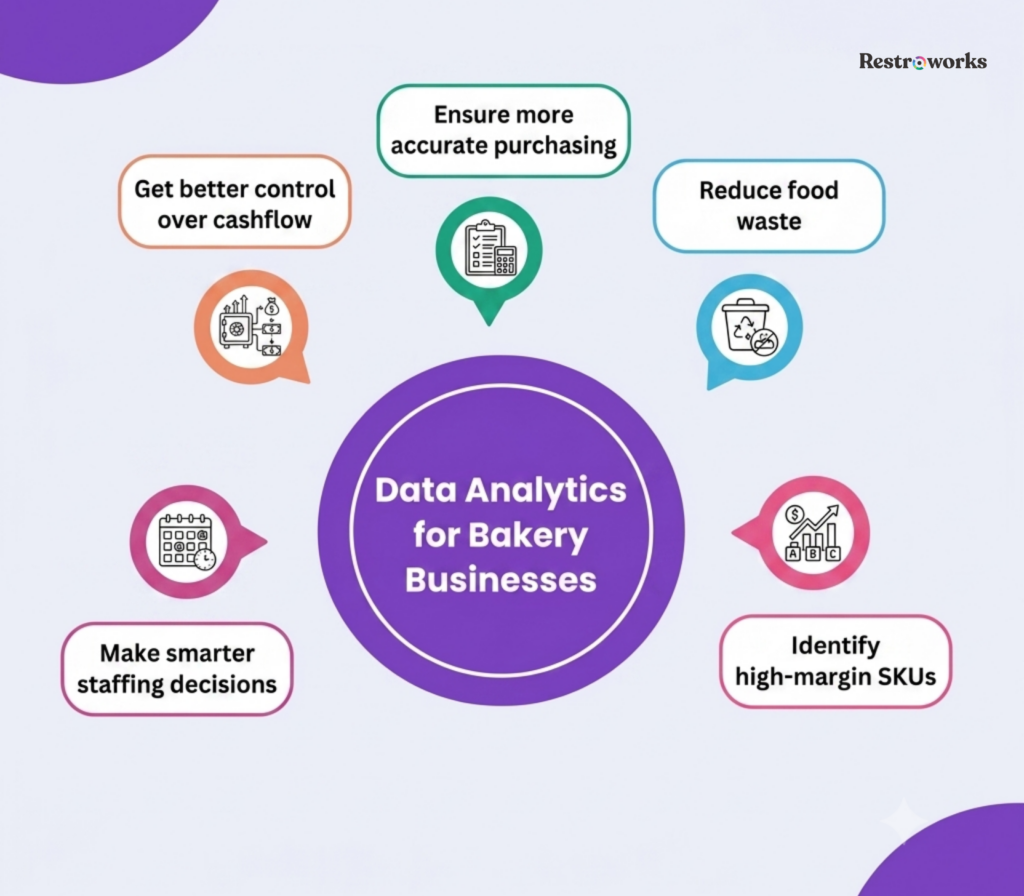
In fact, 82% of businesses say they benefit from using data and analytics, according to KPMG research on consumer products. Data analytics help you-
- Reduce food waste: With data, you can forecast demand more accurately and plan prep with expected sales to minimize waste and save costs.
- Better cash flow control: When you track ingredient turnover, stock levels, and dead stock regularly, you can avoid locking in your working capital into slow-moving inventory.
- Higher-margin sales: Insights into menu item performance help you identify which SKUs mostly contribute to sales, so you can prioritize them.
- Smarter staffing decisions: Sales trend analysis helps align labor scheduling with production intensity and customer traffic.
- More accurate purchasing: With a better understanding of seasonal demand and sales history, you can plan procurement better and reduce emergency purchasing.
The biggest advantage of data analytics, however, is decision quality.
Essential Data Analytics Areas for Bakeries
The US bakery products market is expected to grow at a CAGR of 3.1% from 2023 to 2027, reaching $97.7 billion in 2026. This means growth opportunities are there; all you need is to stay ahead with data.
Here are some of the core areas where data analytics delivers the most value for your business-
1. Sales Trend Analysis and Demand Forecasting
In bakery operations, demand changes constantly across weekdays, seasons, holidays, weather conditions, and time of day. It’s important you track these shifts to avoid both overproduction and stock shortages.
Analytics in the bakery sector allows you to plan production based on these changes. For instance, you may decide to increase production for your plum cake during the holiday season because past data said so. Smart analytics helps you identify-
- Product demand by hour or daypart-wise
- Increase in sales during seasonal and festive periods
- Fast-moving vs slow-moving SKUs
- Demand variations at the outlet level
- Sales performance across dine-in, takeaway, and delivery channels
With time, this will improve batch planning, staffing schedules, procurement timing, and product availability during peak periods.
INDUSTRY INSIGHT
2. Inventory Management and Waste Management
Inventory analytics helps you control one of the biggest cost risks in bakery operations: perishability. Without accurate tracking, you may end up procuring excess inventory or baking extra batches, which results in spoilage and waste.
This, in turn, reduces your margins.
Restaurant management software with analytical features helps you track inventory usage and expiration dates. It enforces FIFO (First-In-First-Out) and FEFO (First-Expired-First-Out) protocols with automated alerts.
Plus, you can see daily production waste, dead stock, and supplier performance and cost fluctuations for better inventory management. With these insights, you reduce unnecessary purchasing, improve stock rotation, and identify ingredients generating recurring waste.
Supplier analytics also helps you evaluate delivery reliability, pricing trends, and procurement efficiency over time.
3. Cost and Profitability Analysis
Wouldn’t it be great to know which menu items, categories, or customers are the most profitable to produce for your bakery business? Data analytics is your answer.
For instance, if a certain product, like bagels, takes more time and effort in terms of labor, ingredients, or preparation, and generates lower margins, analytics will show this.
It will also tell you when and where ingredient costs change, and help you evaluate the menu pricing and profitability according to it. This makes it easier to lock in supplier pricing, adjust recipe costing, or optimize menu prices to maintain profits.
4. Customer Behavior and Segmentation
Customer data helps you understand buying habits beyond total order volume. You can see which products customers buy together, how often they return, and what type of offers increase repeat purchases.
You can understand-
- Repeat order frequency
- Average order value
- Bestseller menu items
- Loyalty program activity
- Customer response to festive launches or discounts
For example, if weekend customers frequently order coffee with desserts, you can create bundled offers around those combinations. A good example of marketing data integration success is Magnolia Bakery, which scaled from a single store in Brooklyn to nationwide using unified customer data integration.
Key Performance Indicators (KPIs) Every Bakery Should Track
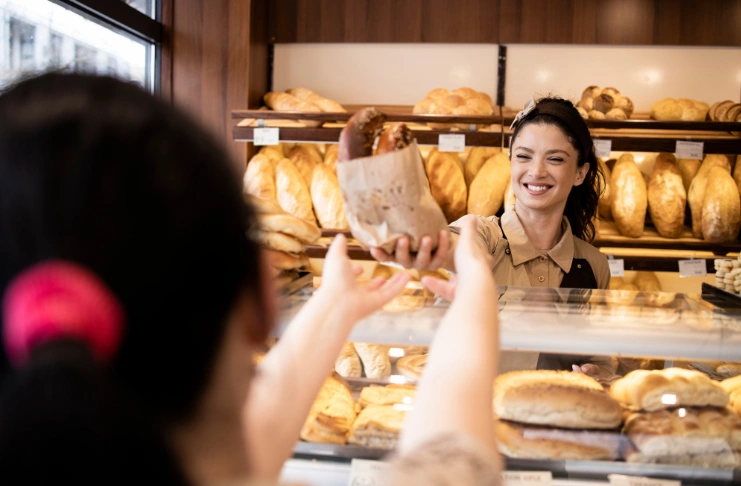
Sales isn’t the only thing you should be tracking to determine bakery performance. Along with it, the more useful metrics are those that show what’s happening in production, inventory movement, customer demand, and product performance day to day.
These include-
- Food cost percentage is an important profitability metric that measures the total cost of ingredients against the revenue generated by them.
- Labor cost percentage measures the total labor costs against total sales.
- Daily sell-through rate measures the percentage of raw material or menu items sold during a specific period.
- Production variance measures the gap between planned production and actual output.
- Margin by product tracks your menu item profitability. Even your bestselling product can be hurting your profits. Baked goods like custom cakes, laminated pastries, or premium desserts carry high labor and ingredient costs.
- Average order value (AOV) tells you the average amount customers spend per order.
- Repeat purchase frequency helps you track how often a customer returns to your bakery and is a good indicator of loyalty.
- Inventory turnover is an efficiency metric that measures how quickly you use and replace inventory.
How to Implement Data Analytics for Bakery Businesses
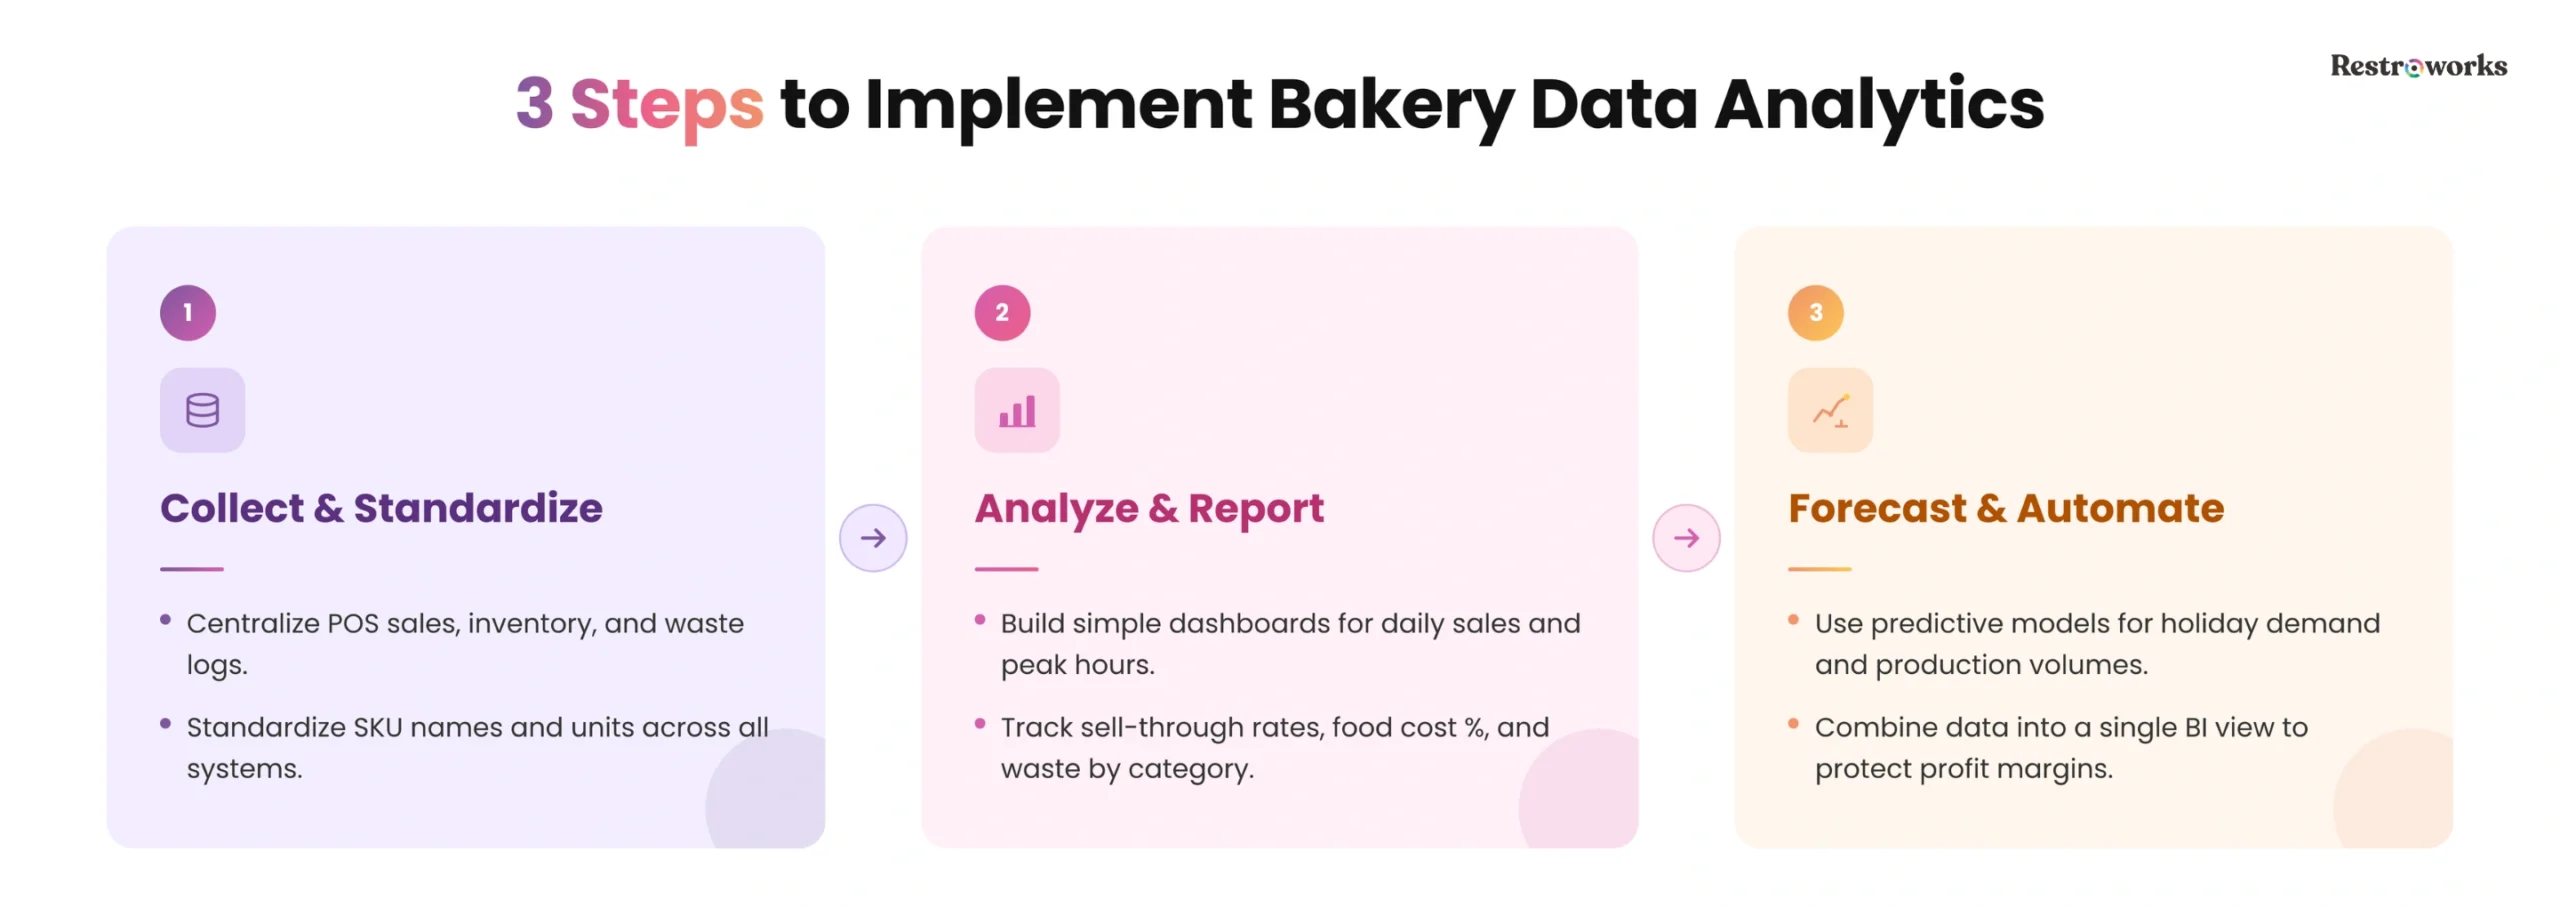
Implementing data analytics into your bakery operations starts with identifying areas where you need better visibility.
The idea isn’t to track every possible metric. That’ll just confuse things even more. But the goal is to build a system that helps you respond faster to demand shifts, cost changes, and product performance trends in your bakery.
Phase 1: Data Collection and Organization
Start by centralizing the data that directly affects daily bakery operations. This includes POS sales data, inventory usage, procurement records, wastage logs, production batches, customer orders, and preferences.
Once you connect this data to an analytics tool, you can track how purchasing decisions, production volume, and customer demand affect each other.
At this stage, your focus should be on maintaining consistency to make data comparable. For this, use standardized SKU names, recipe measurements for quality control, inventory units, and product categories across all systems.
If different teams record the same product differently, you won’t be able to understand and compare reports quickly.
Phase 2: Basic Analytics and Reporting
Once you organize your data properly, start building simple reports and dashboards around your core bakery metrics. At this stage, you do not need complex predictive models. You need clear visibility into what products are selling fastest, where waste increases, how inventory moves, and which hours drive the highest revenue.
For instance, you can start with reports for-
- daily sales trends
- sell-through rates
- food cost percentage
- waste by category
- peak-hour sales
- inventory movement
Even basic dashboards can reveal useful patterns quickly. You may notice weekend spikes for certain desserts, recurring stock shortages during morning rush hours, or specific products that generate high waste despite average sales performance.
Phase 3: Advanced Analytics and Automation
At a basic level, analytics helps you track sales, waste, and inventory performance. With advanced analytics driven by tech and automation? You can do more.
It starts answering more complex questions. How much inventory will you need for the next holiday period? Which products are likely to be in demand next week? Which customers are most likely to respond to a promotion? Advanced analytics uses historical data and predictive models to answer these questions.
A. Predictive Analytics for Demand Forecasting
Most bakers forecast demand using historical data and sales trends. Predictive analytics adds more context by considering factors such as seasonality, holidays, weather, local events, and customer ordering patterns.
For example, your POS sales report shows that croissant sales increase every December. A predictive model can identify when that increase usually begins, how long it lasts, and how much inventory you may need to support it. That’s way smarter, isn’t it?
You can easily apply predictive modeling in forecasting across-
- Planning for the holiday and festive period demand
- Ingredient purchasing forecasts
- Plan production volume workflows
- Predicting stockout risks
- Staffing forecasts during peak periods
What’s more, these forecasting models keep getting more accurate because they continuously learn from new sales and inventory data to improve predictions.
B. Business Intelligence Dashboards
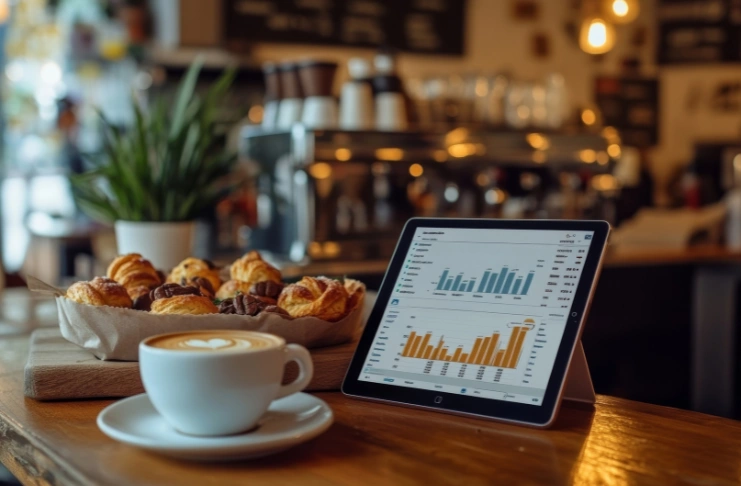
After a certain point, reviewing reports one at a time no longer works. You review your bakery sales numbers every week from the POS reports and check your inventory only manually. The problem is that data is not supposed to be used in isolation.
Here’s an example. Say chocolate prices increase by 15% due to demand-supply chain changes. You see that your sales report looks fine because customers are still buying your chocolate cookies and cakes.
But a few weeks later, profits began to decline. Then procurement costs increased. And now, food cost percentages are up as well.
If you had tracked these changes together, you might have predicted the increase in food costs much earlier. That would have given you time to adjust pricing, review recipes, and renegotiate supplier contracts.
Business intelligence (BI) dashboards bring these data sources together into a single view. This means you can review all the key insights together and see how different parts of the bakery operations affect each other.
There are a number of excellent tools on the market, such as Microsoft Power BI, Tableau, Qlik Sense, and Zoho Analytics, for building these dashboards.
C. AI Integration and Machine Learning
A bakery managing multiple locations, hundreds of SKUs, wholesale orders, delivery channels, and loyalty customers is dealing with a very different volume of data. At that scale, reporting alone doesn’t always help to identify important patterns.
Artificial Intelligence and machine learning help process large datasets much faster than manual analysis. They can identify unusual inventory consumption, recommend production quantities based on recent demand, flag products with rising waste levels, and suggest personalized offers based on customer purchasing history.
For example, if your jar cakes have started underperforming across several locations, the system will let you know so you can take action. This allows you to respond faster and spend less time digging through reports.
Every bakery generates data. The difference lies in what you do with it. When you start turning that information into action, you can spot opportunities earlier, solve problems faster, and make data-driven decisions across the business.